How was your issue detected?: Did you noticed any other signs of this issue around your home?:
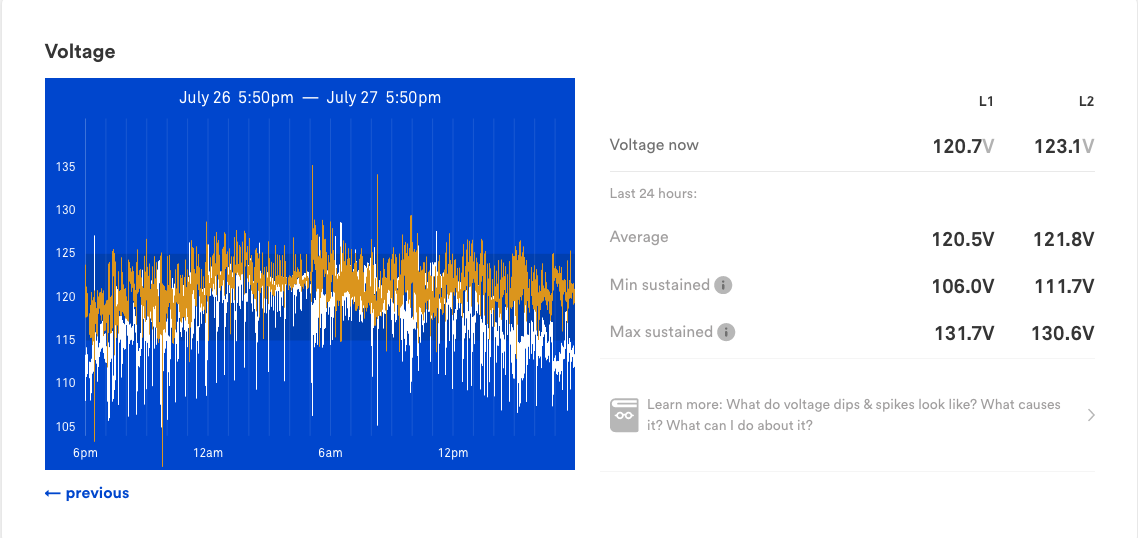
This house is much more electrical based than my previous one where most things were propane. We’ve noticed lights dimming quite often and while I hadn’t had a chance to really think much about it, I did notice the alert in sense that showed lots of low voltage events. We’ve only been here just a week but the data is for 5 days so far.
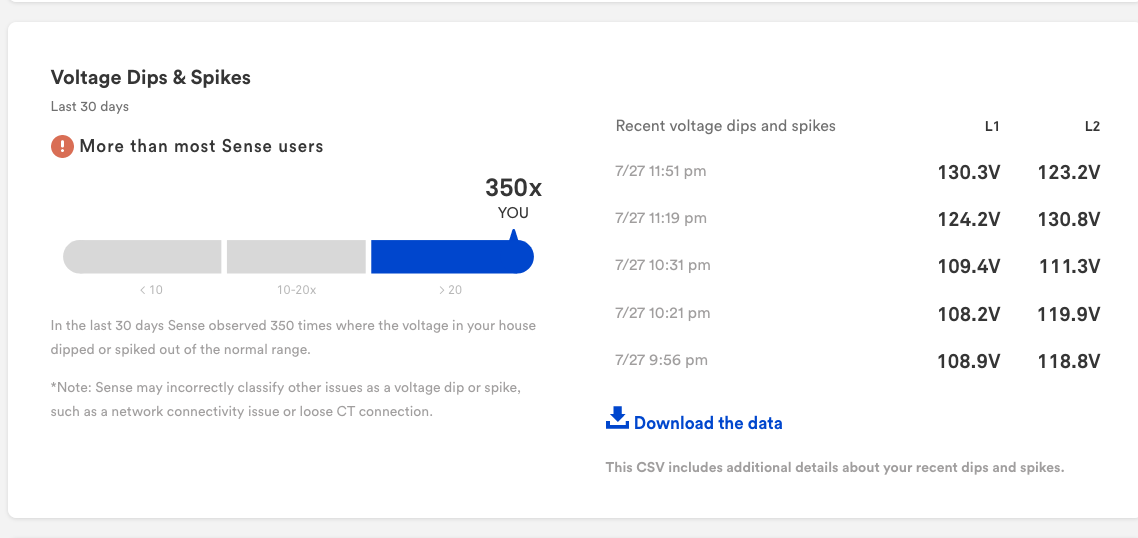
I spot checked some of the recent dips and did not see correlation to devices in my house kicking on at those times (7/27 9:56pm, 10:21pm, 10:31pm)
Everything in my breaker box is pristine, anything else I should be looking at before I call the power company out? I don’t want to leave them with any excuses.
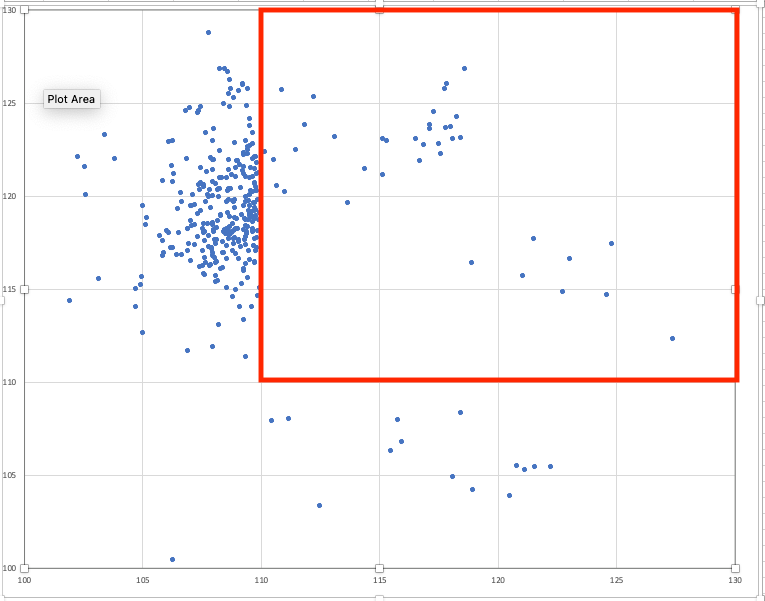
I like to download the csv of the dips and spikes events and plot a scatter chart of the voltage on each leg during each event. That helps visualize whether the dips / spikes are happening in unison, and whether one leg is drastically performing differently vs the other.
You can see from the plot below that dips on leg1 are the main troublemakers.
Try a scatter plot, without a time axis - just one leg voltage vs the other for the same time point. Just looking at your plot, it looks like leg0 is the major culprit, but not always. A scatter plot will really make that stand out.
Nice. You can see a scattering all around the outside of the 110-130V box, though most points look low on the leg0 side. That both voltages are above and below tends to indicate to me that your utility is having challenges. I added the “normal” box in red.
One more note. The points inside the box are probably ones where the Sense was triggered by a max rather than min. You plotted minimum_leg0 vs minimum_leg1. You also have to plot maximum_leg0 vs maximum_leg0 columns, to see the full picture.
Finally had some time to call the power company (Eversource). They were here within an hour of my call. Pulled the meter and found a broken neutral at the connection by the road (I have buried service). This neutral was shared with the neighbor so it seems like we collectively had a floating neutral between the two houses. It might be a useful data point for the floating neutral lab to take a look at the data for future enhancements. In a few days when the lab updates based on the repair I’ll share the new charts.
Thanks to @kevin1 for his helpful scatter plot - glad you were able to come to a solution here. From your description, it sounds like Power Quality was able to provide some data behind the observations you noted (flickering lights, for example). Out of curiosity, would the flickering lights alone have been enough to prompt you to reach out to Eversource?
Given that this was a new house, I may have accepted the dimming lights as normal for this house. In fact, that is exactly what I was thinking until I stumbled on the lab data. Eventually through some other mechanism like my smart upc constantly kicking in for seconds at a time I may have started to be more curious but this definitely helped me zoom in. Coincidentally, looking at the latest labs data, it seems like there still could be an ongoing issue, but I’m letting a bit more data accumulate before I ask them to investigate more:
It’s pretty obvious here where the conductor was repaired:
And yet, I still seem to be having a number of dips every day. I need to look a bit closer, but it doesn’t seem to correlate with my devices kicking in.
When I download the csv, the times are what appear to be zulu / UTC, is that a correct interpretation?
Just a follow on, 6 weeks later. Fixing the floating neutral dramatically improved the situation but didn’t fully eliminate the power dips. Eversource called back to see how things were and I had been watching to get more data. Since there were still a lot of unexplained dips shown by Sense, I asked for them to place their monitor. They did this and recorded the data for about a week. I just heard back that they agree this is not good and are looking at the transformer and possibly updating my drop (400+ ft underground).
Hi there. I was seeing a similar problem where one circuit in the house had lots of flickering and lots of UPS kicking on and off. I replaced the breaker in the box for that circuit and the problems went away. That might be helpful to you.