Good idea on exporting data to take a look at things. I’ll try that later.
I think I’m still not clear on how always on is calculated. My understanding was that the system looks at the “low water mark” for overall usage over the previous 24 hours, and that number is then set as the always on value. With smartplugs in the mix, I’d expect the value to then have the determined minimum usage for each smartplug load subtracted. Is my understanding off?
Always On with smartplugs may be the low water mark minus the historic mins of each individual smartplug. Or it may be the low water mark of total usage minus power going to all the smartplugs at each moment in time.
A little more fun with Always On blips - Downward spikes in hourly Always On are definitely a good indicator of Sense monitor issues, either from a data transfer or a data read perspective. I very carefully analyzed my Power Meter waveforms from Jan to mid-Aug 18 for two types of monitor issues, data dropout and negative Total Usage. I then mapped those issues vs. downward spikes in Always On. The X’es below represent downward spikes from the 12 hour moving average that is greater than 80W. The dots represent visible errors in Sense data.
I then tried to use a couple of different algorithms to find similar issues solely via my Always On waveform from late-Aug to mid-Nov 18, using my Jan to mid-Aug data for training. I avoided using a time domain (RNN/LSTM) algorithm for a couple of technical reasons, but instead used the two adjacent hourly Always On readings on each side of the sample point, plus the sample point reading as the “features”, to give me a time element. Here’s the resulting waveform and list with predictions based on the Optimal Weighted Nearest Neighbor Classifier (“ownn” model in caret) …
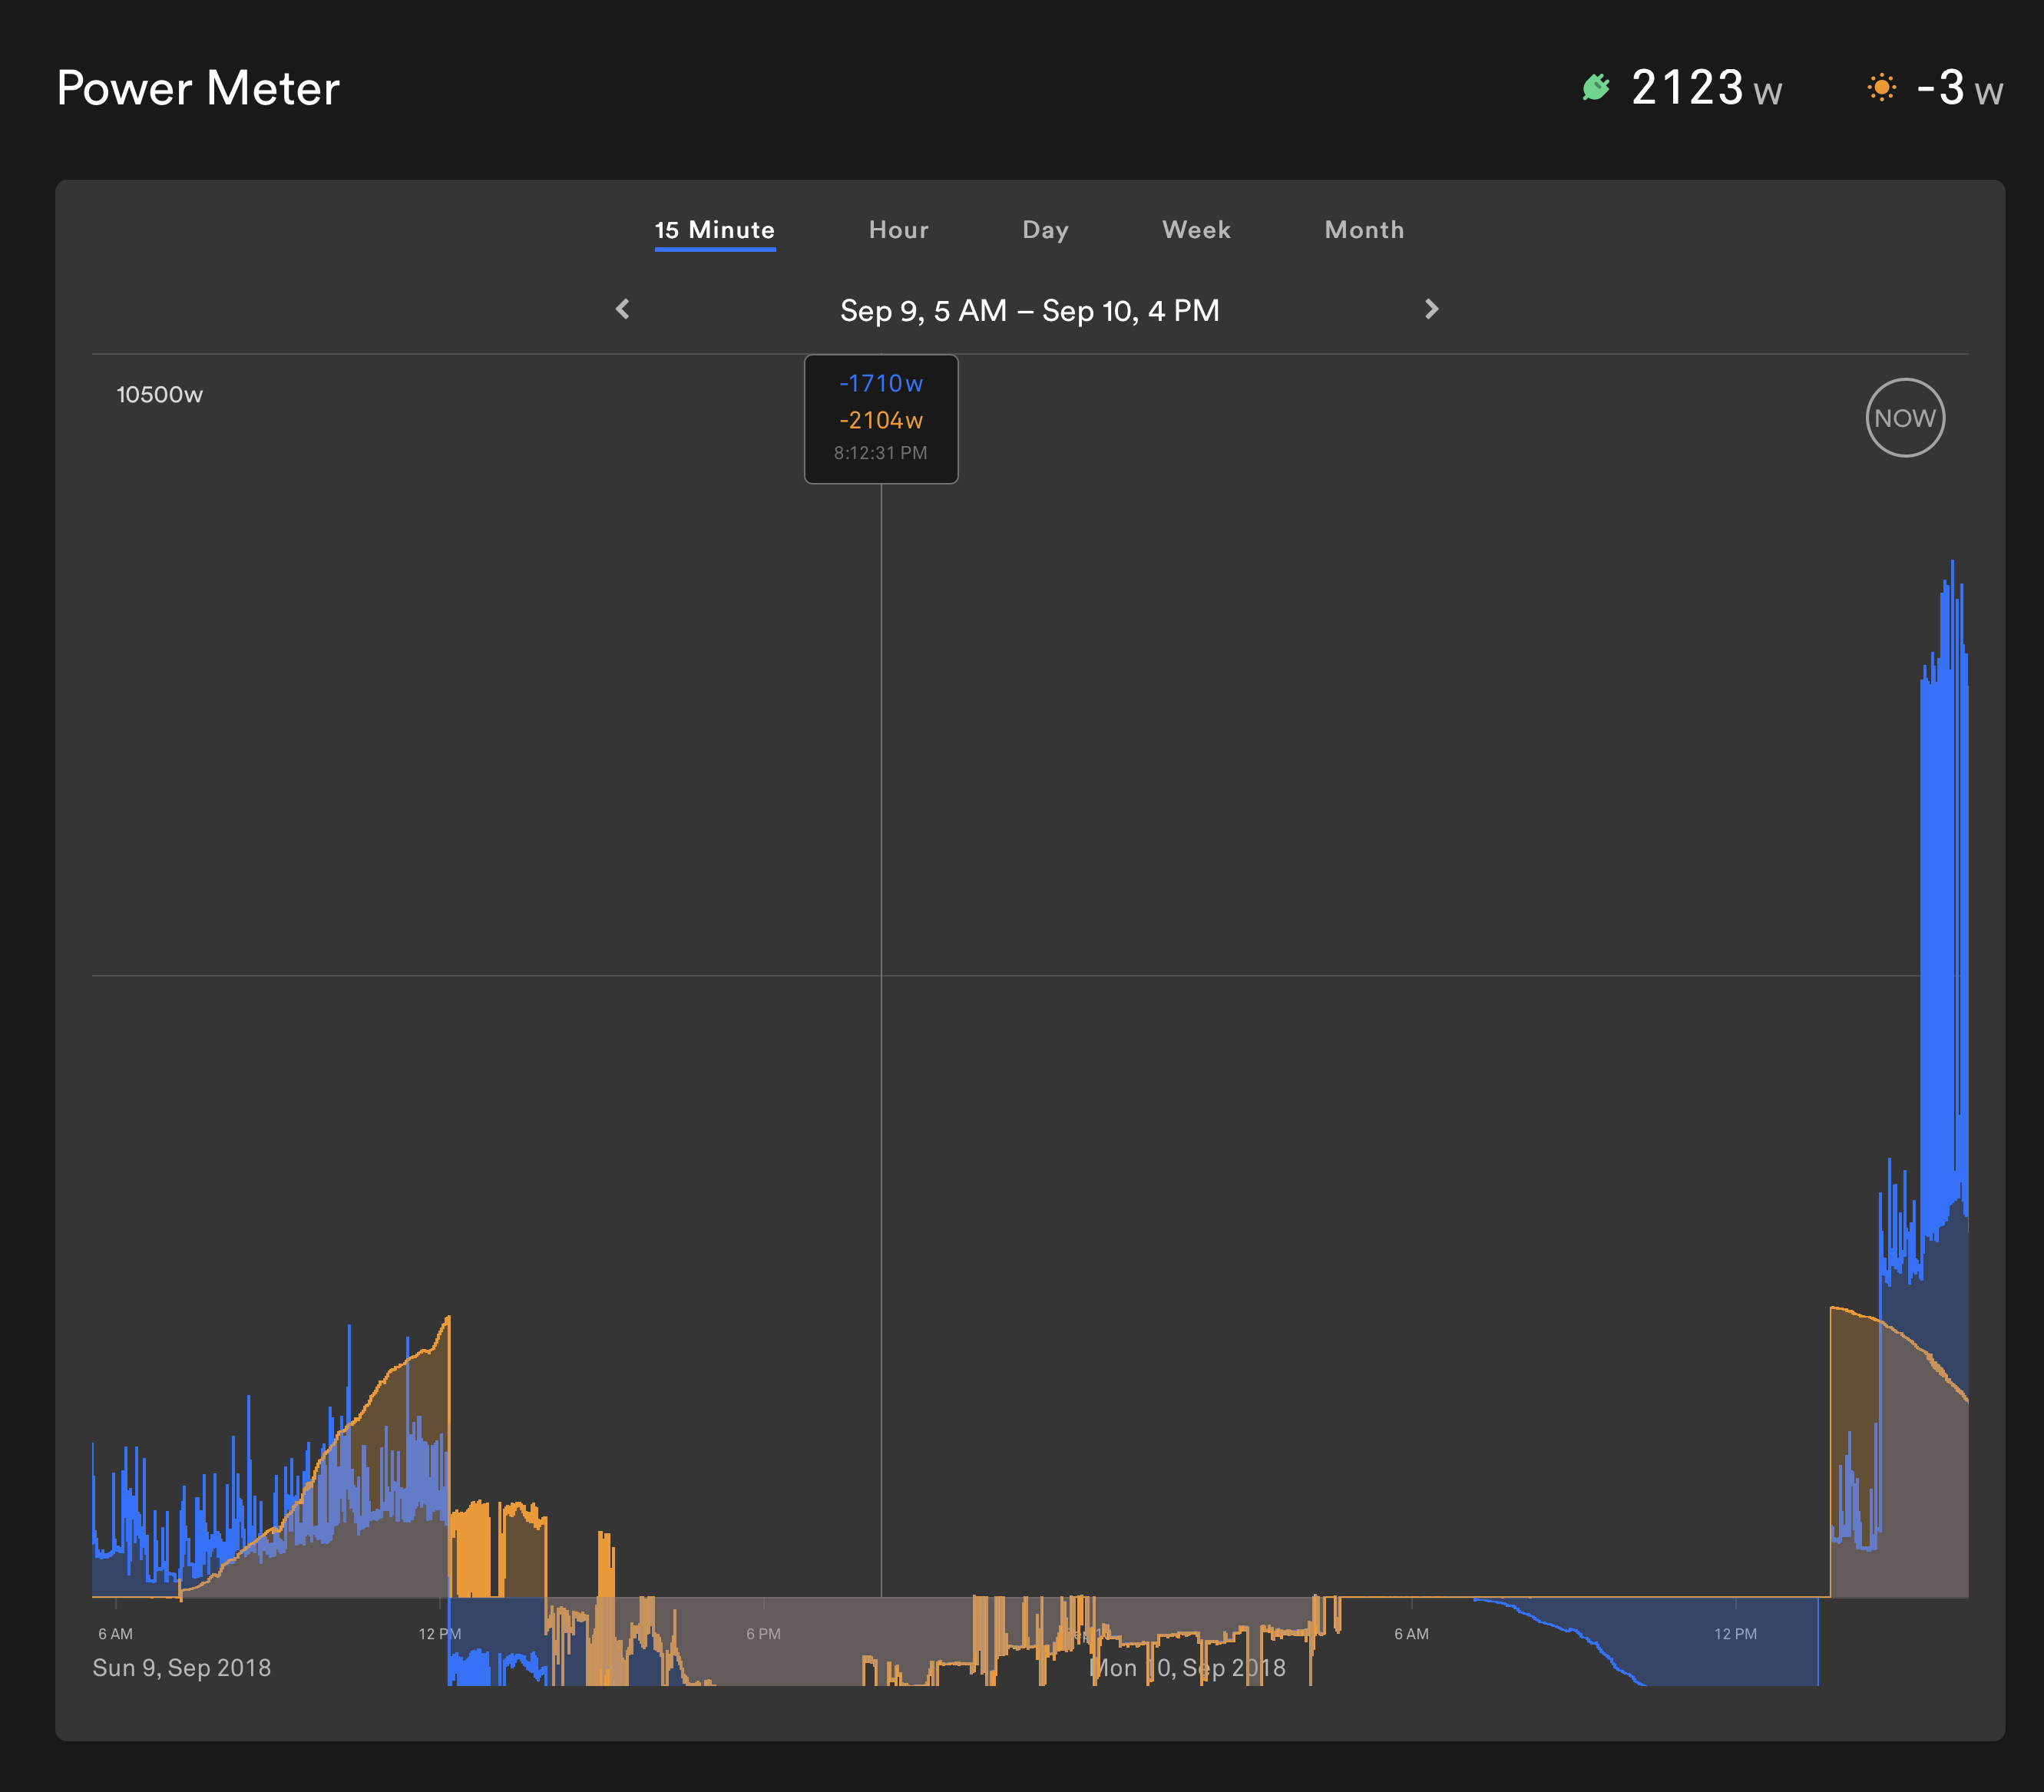
No surprises, but it looks like the neural network did an OK job figuring this out. All 18 “Gaps” it found looked similar to this from a Power Meter perspective:
But if you notice, Always On was zeroed out that whole time, so it “knew” something was up.
Now, you may be asking why my smart little neural network didn’t flag the hourly Always On downward dip to zero in the 1AM hour on Dec 4th that I have circled (I asked that question immediately). Amazingly, the neural network is smarter than me ! Here’s the Power Meter waveform - perfectly normal, so not all downward dips are issues !
I decided to do one more probe into Always On data to see how it has varied over time in my household for as long as I have had Sense data available (reset at the start of Aug 17).
First a view of the detailed data:
Red dots are aggregated daily Always On totals
Blue dots are hourly Always On x 24 (to normalize with daily)
Green dots on the bottom indicate that there was some good data for that clock hour (still could be a data dropout for part of that hour).
Orange dots at the top indicate data was missing for an entire clock hour.
A long stable period from Aug 17 until June 18, where Always On mostly stays in a stable zone, though the number of hourly dips in Always On increases after March 18.
A wilder period of swings between June 18 and mid-Aug 18.
A very flat, low period between mid-Aug and Mid-Sep 18
A resumption of higher Always On with wider swings from mid-Sep to the end of Oct 18.
The start of the smartplug beta at the start of Nov 18, with a falling Always On as smartplug always on data gets pulled out of Always On. More dropouts and outlier low Always On hours.
The start of a new Always On calculation around Dec. 20. Lots of hourly dropouts and shorter dropouts as well.
Starting Jan 1, 2019, I did several things to reduce dropouts and they seem to have partially worked.
I’m guessing that each of these domains corresponds to different tweaks of the Always On computation, or the way that Always On data gets aggregated into hours for export, each of which is probably as separate chunk of code handled by different people.
For a long time, I’ve been trying to figure out ways to detect/predict dropouts that aren’t visible in export because they don’t cover a full clock hour. I know many exist because I can see plenty in the Power Meter, plus I observed a bunch when I was looking for discrepancies vs. my utility data. I started looking at all sorts of complex R packages to detect time series anomalies, but then realized that I had yet to do one of the simplest used in R - Time Series Decomposition. It breaks down the series data into a ‘trend’, ‘seasonal/periodic’, and ‘random’ component using the Berlin Procedure algorithm.
Even though Always On is supposed to have relative stability over a 24hr (or 48hr) period because of the way it is derived, I decided to apply a 24 hour periodicity to the decomposition, and I used ‘additive’ vs. ‘multiplicative’ decomposition. The results were interesting:
I paid special attention to the ‘random’ component of the time series decomposition as that really highlights anomalies from any periodic trends or long-term trends. After peering to the negative dips, I found that there was magic threshold around -0.05kWh. Virtually all random dips below -0.05kWh represent some kind of data dropout ! Voila…
I suddenly lost all but 2 of 8 really AO devices (all on smartplugs) without any perceptible change in anything.
e.g. in AO stats I’m seeing “UniFi Switch ~12w” over last 24hrs. The switch is on an HS300 and using a near-constant 45w and has been listed as-such (in AO) until sometime today.
Makes me wonder about current vs power assessment of AO … I think my supply voltage has swung up a little lately post summer lows.