Is the sense dashboard accurate? It seems to have changed

I’ll preface this post with some history: I’ve been collecting data with Sense for about 4 years now. All along, I have kept a spreadsheet with one row per day that collects the sense reports for solar production and total usage, and computes the “net to grid” (which can be positive or negative) from that. I have also collected the net usage reported by PG&E from my meter.

Until about May this year, those two net usage values were always very close together. Since then (I only discovered this recently, as I was behind in updating the spreadsheet), larger discrepancies have shown up, sometimes as large as 10 kWh per day. No changes have been made to my panel since October 24. This means things were okay for 6-7 months after that, but then they went off the rails.

For example, on October 9, 2025, Sense recorded 36.8 kWh in usage and 22.8 kWh in solar production. Thus, the net, according to sense, was: 14 kWh used from the grid. PG&E says 45.9 kWh from the grid. That is a huge difference. The usage was so high anyway, because I was charging my car from midnight to about 7 AM. An independent measurement from the charger shows it actually uses 41.4 kWh. With that in mind, it is impossible that Sense could have reported only 36.8 kWh in usage.

Hour-by-hour data from PG&E shows consumption during the charging hours of about 47.82. Subtracting the known usage for charging results in 6.42 used during the night. That is about typical for us at this time (standard devices, electric water heater due to late showers by my son, etc.). PG&E also shows 58 total for the day. Subtracting the charging, that is 16.6 for the day, is also typical.

Over that same period (where PG&E reports multiple our of 8kWh), the dashboard bars show 4.6 kWh. A 5-7 hour discrepancy of 4 kWh results in a “lost” amount of 20-28 kWh. That explains almost all the difference.

On October 12 (a non-car charging day), Sense reports 20 kWh used, 34.5 kWh produced, net to grid: 14.5 kWh. PG&E reports net to grid 11.32. According to PG&E, the same nighttime hours use a little over 6, consistent with the above, and adding up the usage bars from sense results in 6.3, so close. Still over 2 kWh “lost”.

I will open my panel and check all CTs to ensure they are still closed, etc., although I have a hard time believing that a change would occur after 6-7 months without the panel even being opened. Is anyone aware of new firmware released around the May timeframe? FYI. I have compared dashboard values between web app and mobile app, and they are the same.

@dolfs,

It sounds like you are comparing Sense Dashboard vs PGE on a day by day basis ? I ask because there were some divergences between the web app (which includes Export) and the phone/tablet possible starting in the August release (maybe earlier). The phone/tablet app was migrated to pulling data from a newer endpoint, while the older legacy endpoint data continues for the web app, Export and informal API. As you can see from this moment in time, the new data endpoint appears to aggrgate/update a little earlier each hour than the older one.

I did a quick comparison for PGE solar net data vs Sense net data (Total Usage + Solar Production) via export for the full 2025 on an hourly basis and things looked pretty good - I see a few bad points, but no real differences between data before and after August. Then again, Export use the old endpoints.

ps: the missing data is from PGE being slow to update data - my data from them only goes through the 14th right now.

Yes, I am comparing on a day-by-day basis. I am trying to establish several things in this effort:

  • Make sure sense and PG&E essentially measure the same consumption
  • Last year I did find that the small-ish differences I had all along were annoying me
  • Careful inspection found the culprit in the wiring of my sense unit (more below)
  • These issues were fix in October 2024, and things had been spot on, until May this year- Have some good statistics allowing me to build month-to-month expectations for future energy use and generation, anticipating the addition of heatpump HVAC and HPWH
  • I am now nearing one year with those two additions, so I went back to the spreadsheet to see if I had budgeted more or less correctly
  • This is when I discovered the current problem- I had been inputting values by hand until recently
  • Production consumption from homeassistant energy panel. This is really redundant, as the information ultimately comes from sense integration with ha
  • Daily input from the Sense Web dashboard
  • Catching up on inputting data from PG&E Usage Bill View for a month or so- But now I did an export (web) for both Sense and PG&E for the year so far
  • I massaged that data in a spreadsheet to ultimately create columns that I could paste into the original spreadsheet
  • Incidentally, the exported data has two decimal digits, whereas the web presentation only included 1. This made for tiny differences (for the better)

Since my issues started in May, I doubt it has anything to do with the endpoint change you mentioned happened in August. Also, many differences go all the way from 1-2 kWh per day to 15 kWh per day on days I charge the car. The endpoint difference could not explain that. I’ll be opening the panel later today to confirm CTs.

Dolf Starreveld

— Mountain View, CA

www | map | email

1 Like

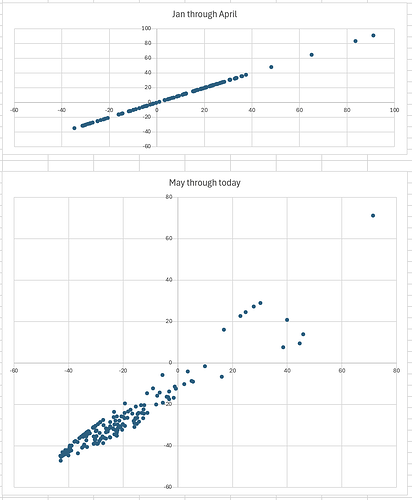
You might want to try a daily plot like the one I just did. That will tell you if the error grows proportionally with respect to net usage (straight line with a different slope than 1, vs a more scatters line of data).

Kevin - Menlo Park

Both plots have PG&E on the vertical axis and Sense on the horizontal axis. I have negative values because of solar sometimes being a net producer, but in winter, a net consumer. My interpretation is that errors only seem to grow with net consumption (right side), but not with net production (left side).

1 Like

@dolfs , I did a quick inspection of Dashboard vs. Export for tablet/phone app vs. web app and everything seems to be in order - same daily values between the two of them (except for the decimal places and rounding you noted). That kind of tells me that something must have happened to your hardware setup in May and beyond.

I just inspected the inside of the panel. Like I said, neither I nor anybody else was in there to make changes. I confirmed CTs are still properly closed… I am stumped.

The most concerning thing, visible on charging days, is that the car’s charging, when operating at full capacity on 32A/240V, is consuming 8.x kW (as expected), yet Sense is only showing 4.x kW. PG&E shows the 8.x. The charger also confirms the 8.x.

With the wires properly running through the CTs and the CTs being properly closed, does this indicate a problem with the CT or the orange box? I would think so…

1 Like

Everything is at or below the unity line telling me that Sense readings are all smaller or equal to PG&E. Next thing I would look at is my Settings > System > Signals to see if Mains and Solar look normal with Solar balanced.

We already knew that from the 4.x readings vs. 8.x readings during charging. I just looked at system>settings. This, of course, only shows momentary values, but they look fine to me:

Mains 471W/469W

Solar 111W/114W

Voltage 122V/122V

Frequent cy 60.0 Hz

1 Like