@kevin1 here is my utility data from that timeframe.
@Ray13, thanks for the hourly data. Quick question - how did you get 86.805 for your first CMP daily value on 12/5 ? I either get 89.714, or 90.005 if I offset by 1 hour backwards to compensate for the way CMP reports.

1 Like
Good catch @kevin1! It should be 90.005. I went back and applied it to the two charts.

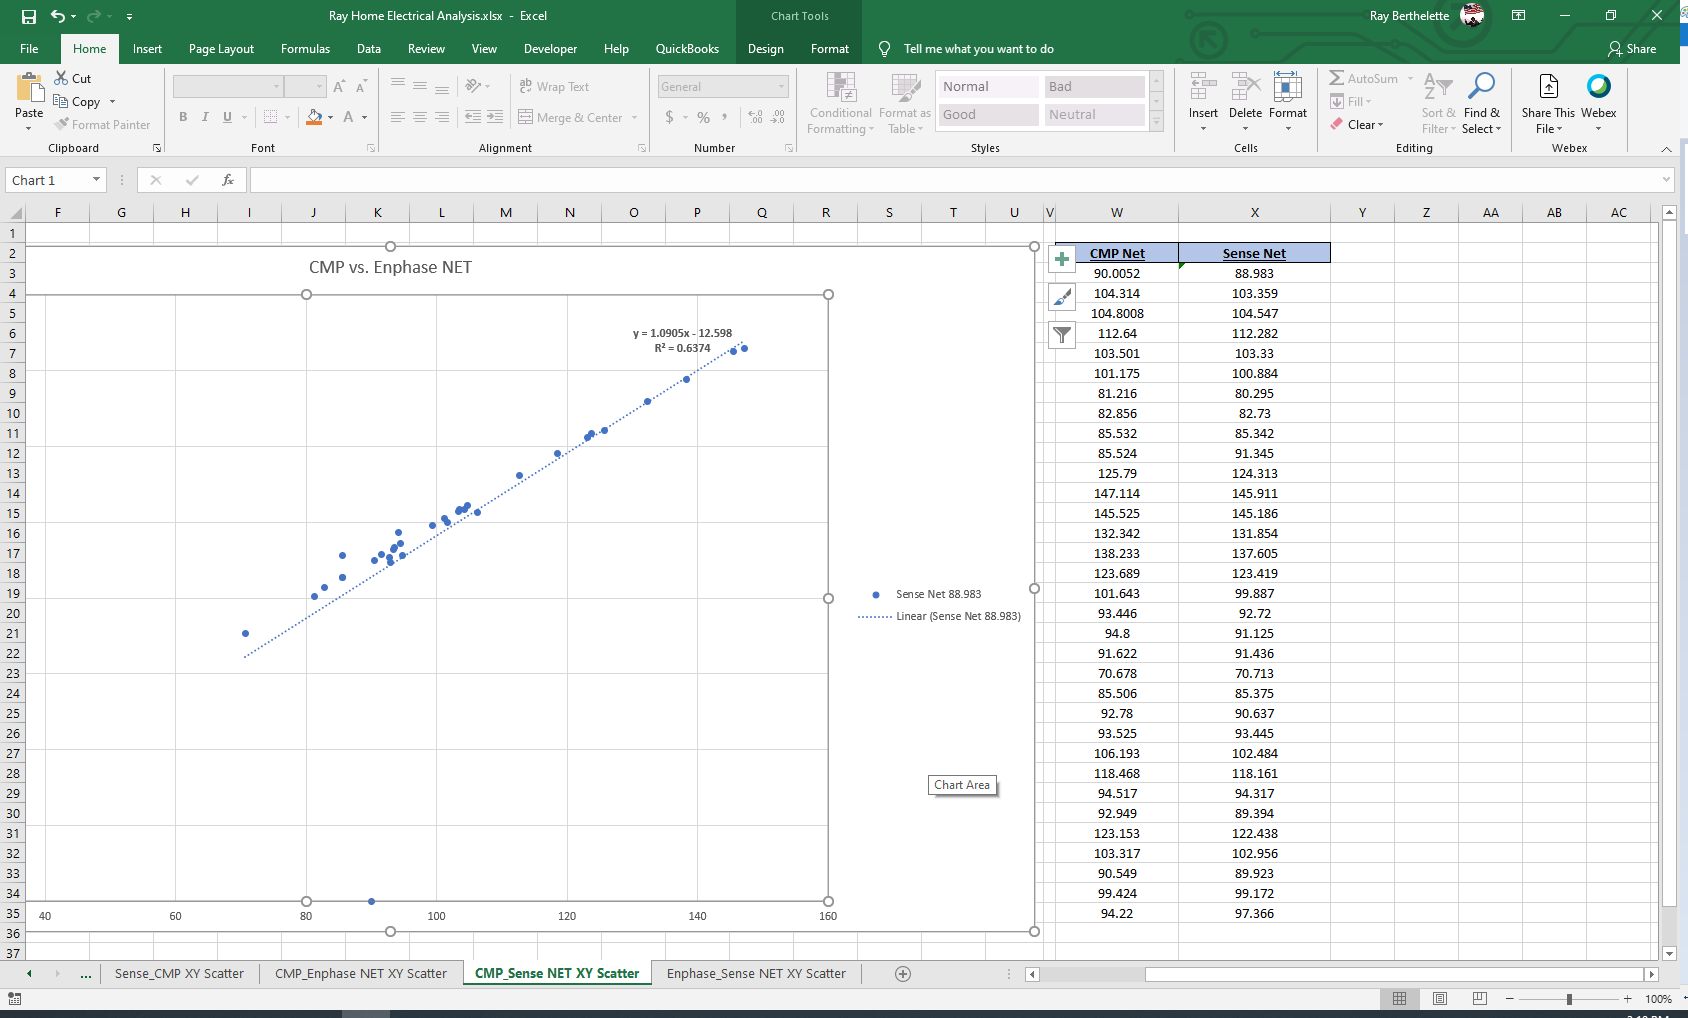
Not sure if that even helped much?
You might need to re-regress the fit lines. But with that change, the fit is much better as told by the residuals. In my case, point 33 and point 1 look like the worst. Point 33 is missing 1 hour, because I had to do the offset and only have the CMP data through 1/6/21 23:00. Picture the residuals as an exaggerated view of the points on either side of the fit line.


If I pull point 33 (1/6/21), both graphs look pretty good.


One thing that is highly noticeable, due to the way the automated labeling worked on these graphs, is the negative y-intercept between your Enphase and CMP net usage, similar to what we saw between Enphase and Sense on the pure solar side (Enphase was always seeing 450W more solar production than Sense, plus a 2.4% differential). If I look at look at the linear models for each pair, I see:
Enphase = (0.974 * CMP) - 0.741 Wh
Adjusted R-squared: 0.9999
Sense = (0.995 * CMP) + 195 Wh
Adjusted R-squared: 0.9997
Sense net usage looks to match your Utility net usage a little better than Enphase, but all three seem close. And I’m guessing from the solar analysis earlier, that Enphase always sees itself as producing a fixed amount more solar energy than is actually seen at the meter.
I think you have done a a good job showing that you can trust your utility meter net result. Now you are ready to get fancy and chart a few more months, all on one graph using CMP as the gold measurement.

The big gap between Sense and Enphase mostly stems from Enphase thinking it is producing more solar than Sense and CMP are able to see.
1 Like
Awesome! Thanks so much @kevin1!
I don’t know if I would go as far as saying I trust my utility meter. That’s the whole point of this exercise is that I don’t trust them, which is why I am using Enphase and Sense as a form of checks and balances just to keep them honest.
The other thing I’m working on is using an RTL-SDR device to try and connect to my meter directly and read the data being sent out. That’s proving to be very challenging!
1 Like
Keep on charting… With three measurement sources and a distinct set of patterns between them, you’ll be able to spot and isolate anomalies in any one them !
I used to have a Zigbee device (a Rainforest Eagle) connected to my meter but Sense kind of outclassed that device because it offered a much better UI, overlaid solar and total usage, plus had a much higher sample and display rate.
This topic was automatically closed 365 days after the last reply. New replies are no longer allowed.