Just as we have a line graph showing instantaneous power usage. How about a line graph showing the energy meter. right now we have bar graphs that can get as resolute as the hour of the day. why not a line graph adding up the energy usage through out the day. let the beginning of the day be zero (or choose it to start from the beginning of the week, or month, or year, or billing cycle, or even to match what the meter says outside  ) and let the line gradually increase as if it were reading the energy meter every second and graphing it on a chart.
Just as with the power meter, we could scroll through the energy meter and see what the meter read at different times,
2 Likes
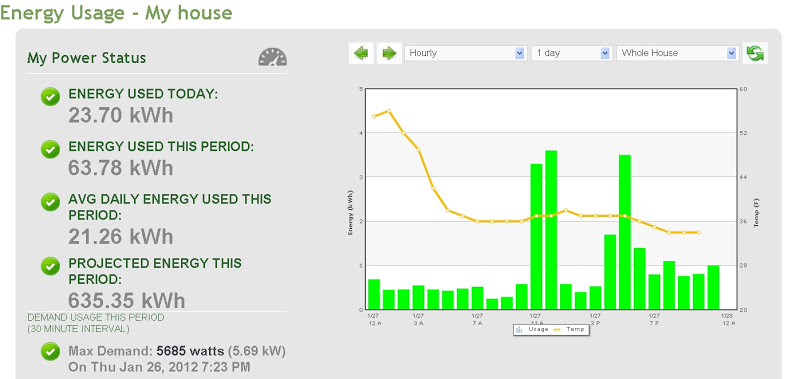
My Eragy had this. I liked it. I had a daily goal to stay under 26kWh per day. My Eragy also offered custom text alerts. When the daily usage hit 13kWh, it’d send a text to every family member “used over half of today’s energy limit”. When daily usage hit 25kWh it was set to text “energy limit reached. Reduce usage.”
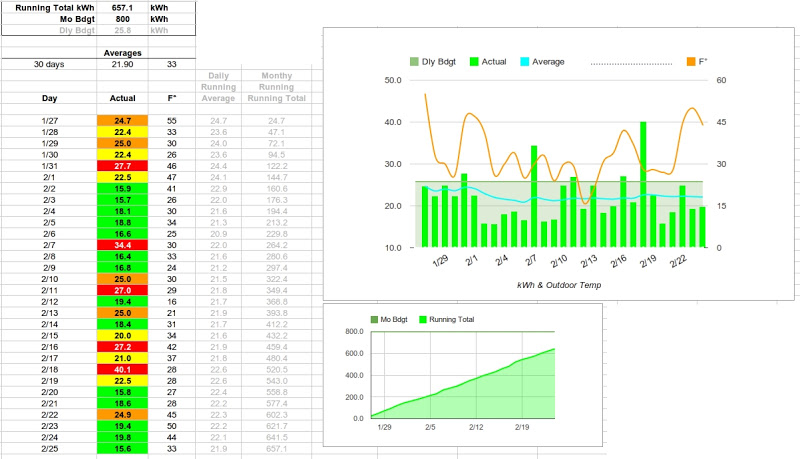
In addition to the line graph of energy usage, there was a straight line across showing the 26kWh energy goal.
1 Like
Actually I’m wrong. The above graph shows my spreadsheet I made.
This was My Eragy:
.
.
.
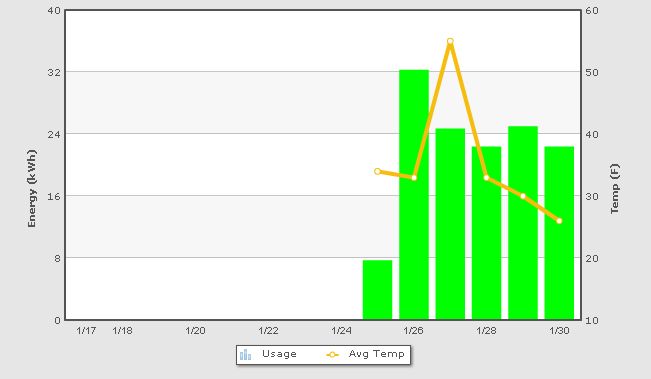
The next pic below shows my old T12 shop lights turning on with 1.2kW

1 Like
how did you do this?
another user sent me this link and said I could use his work, but I am unfamiliar with this type of thing and haven’t a clue how to use it. I’ve tried a variety of things to get it to work, but I am coming to the conclusion that I need something like Splunk to run it.
This was from 2012. On my first pic, the Google spreadsheet with charts, I manually entered everything you see in cells with Black text and in colored cells. Cells would update in color based on the daily kWh value I entered. Cells with grey text were formulated from my entries.
Nothing is automated except formulas and charts.
I had to enter two values per day: kWh per day and temperature from the MyEragy chart in pic 2.
The Custom text and Emails were supported by My Eragy based on their daily goal implementation.
I can provide a copy of the Google spreadsheet, but I can’t until Sunday.
… And I don’t know anything about that wrapper API thing.