Thanks to you @Beachcomber, I did a little deeper analysis on my data for the month of June (really for all of 2023, but in the interest of simplicity, kept things to just June.
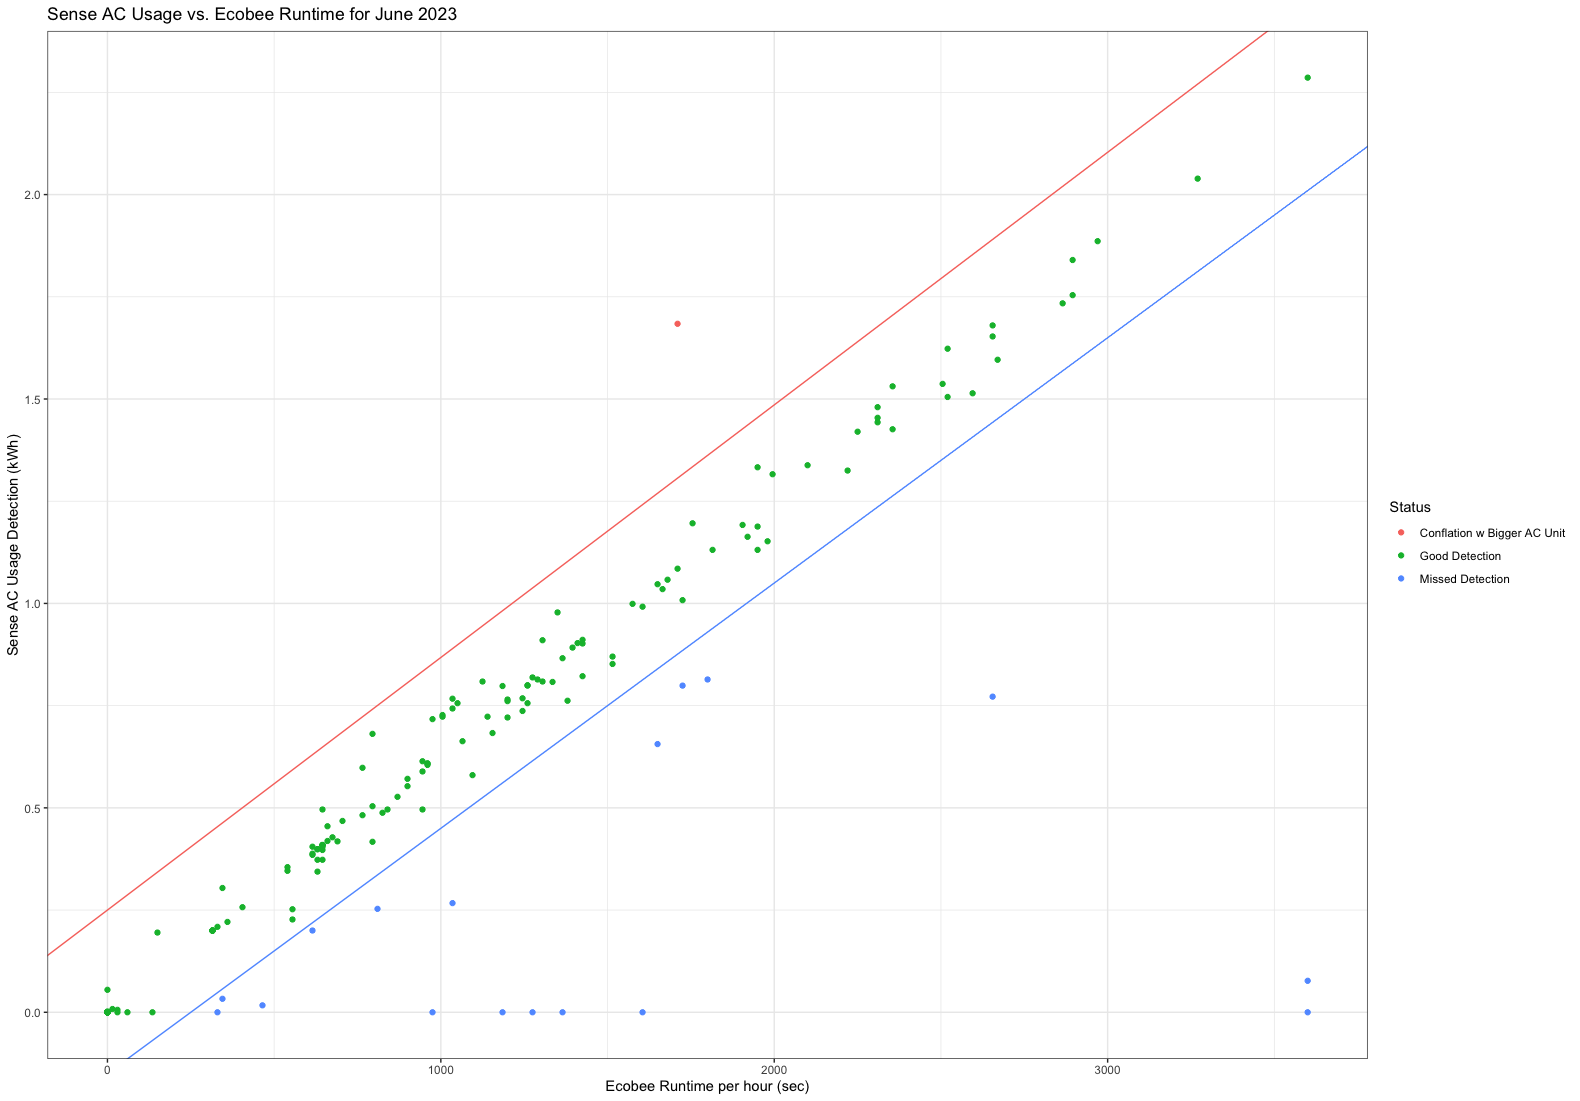
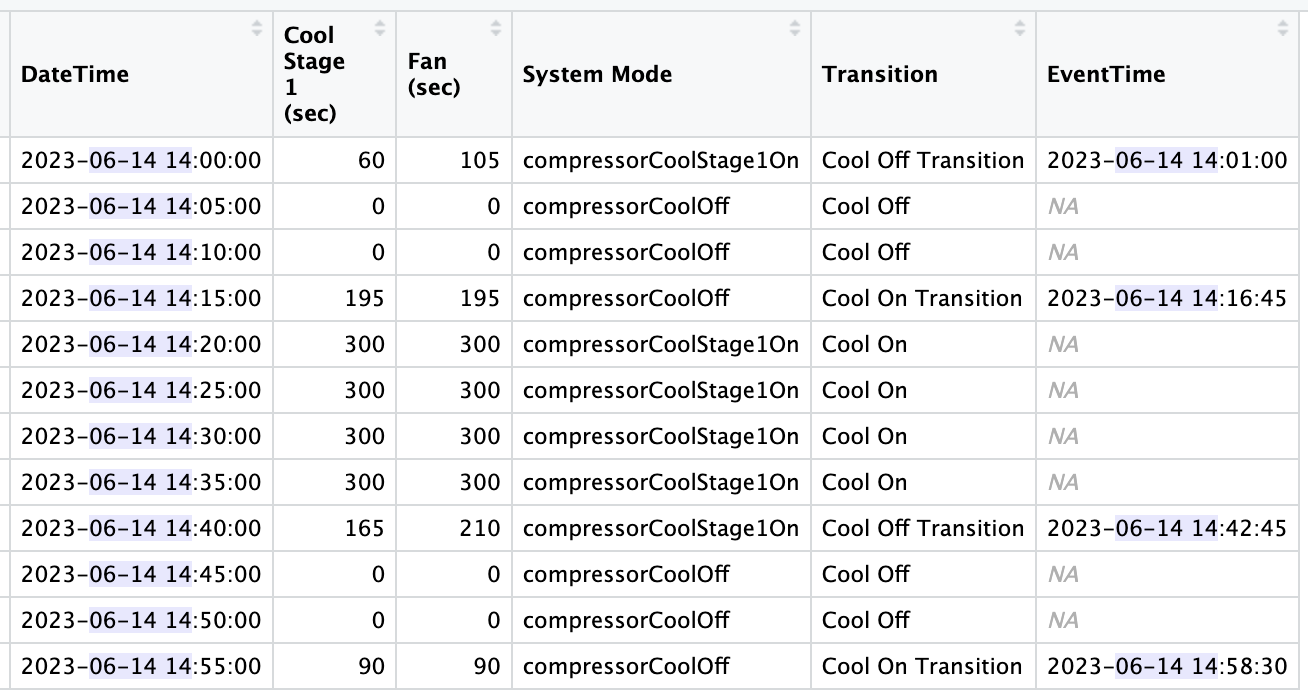
First off, I charted my Ecobee runtimes, in seconds, for each hour in June, against my Sense AC detected power. My upstairs AC unit uses about 2.5kW, 1 hour (3,600 sec) should show as 2.5kWh and I should get a straight line of point from 0, 0 to 3600, 2.5kWh. And the good news is that I essentially get that, with a little noise, in green and a bunch of outliers, in pink and blue.
The outliers well above the “line”, in pink, are cases where Sense is coming up with an energy number that is too big for a given hour of runtime. Since the Ecobee is likely far more accurate about runtime, I believe that Sense is coming up with a bigger number because it is conflating my higher tonnage downstairs AC (3.5kW) with my upstairs unit (2.5kW).
The outliers well below the “line” , in blue, are likely cases where Sense missed a detection or two.
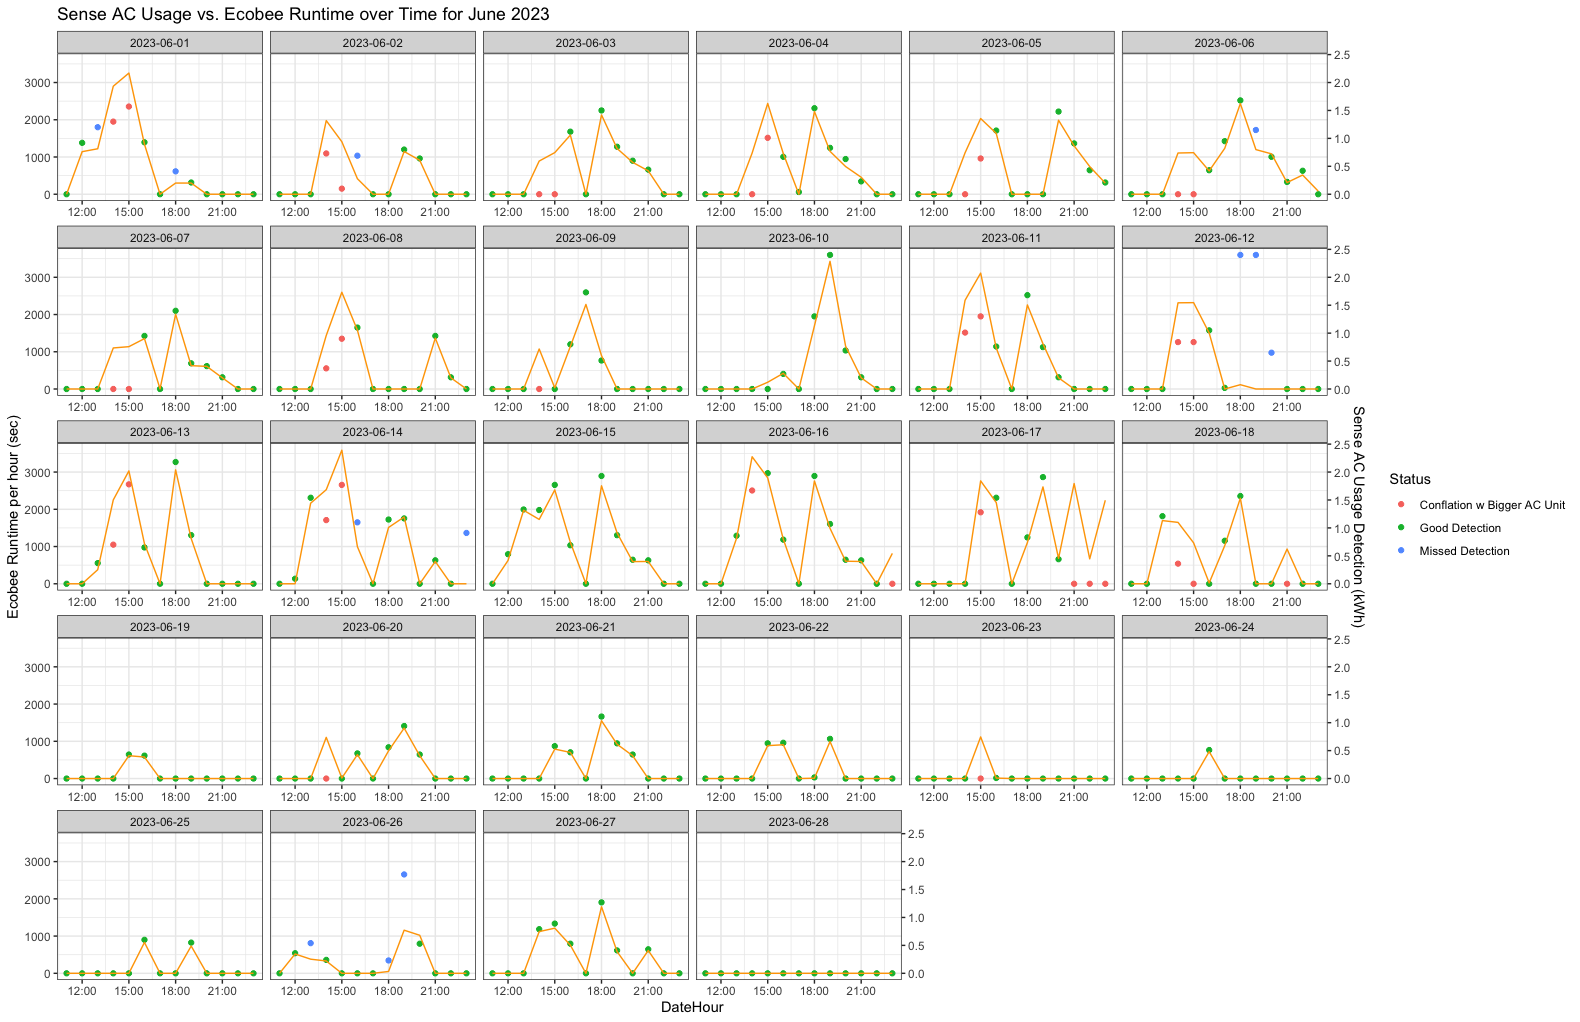
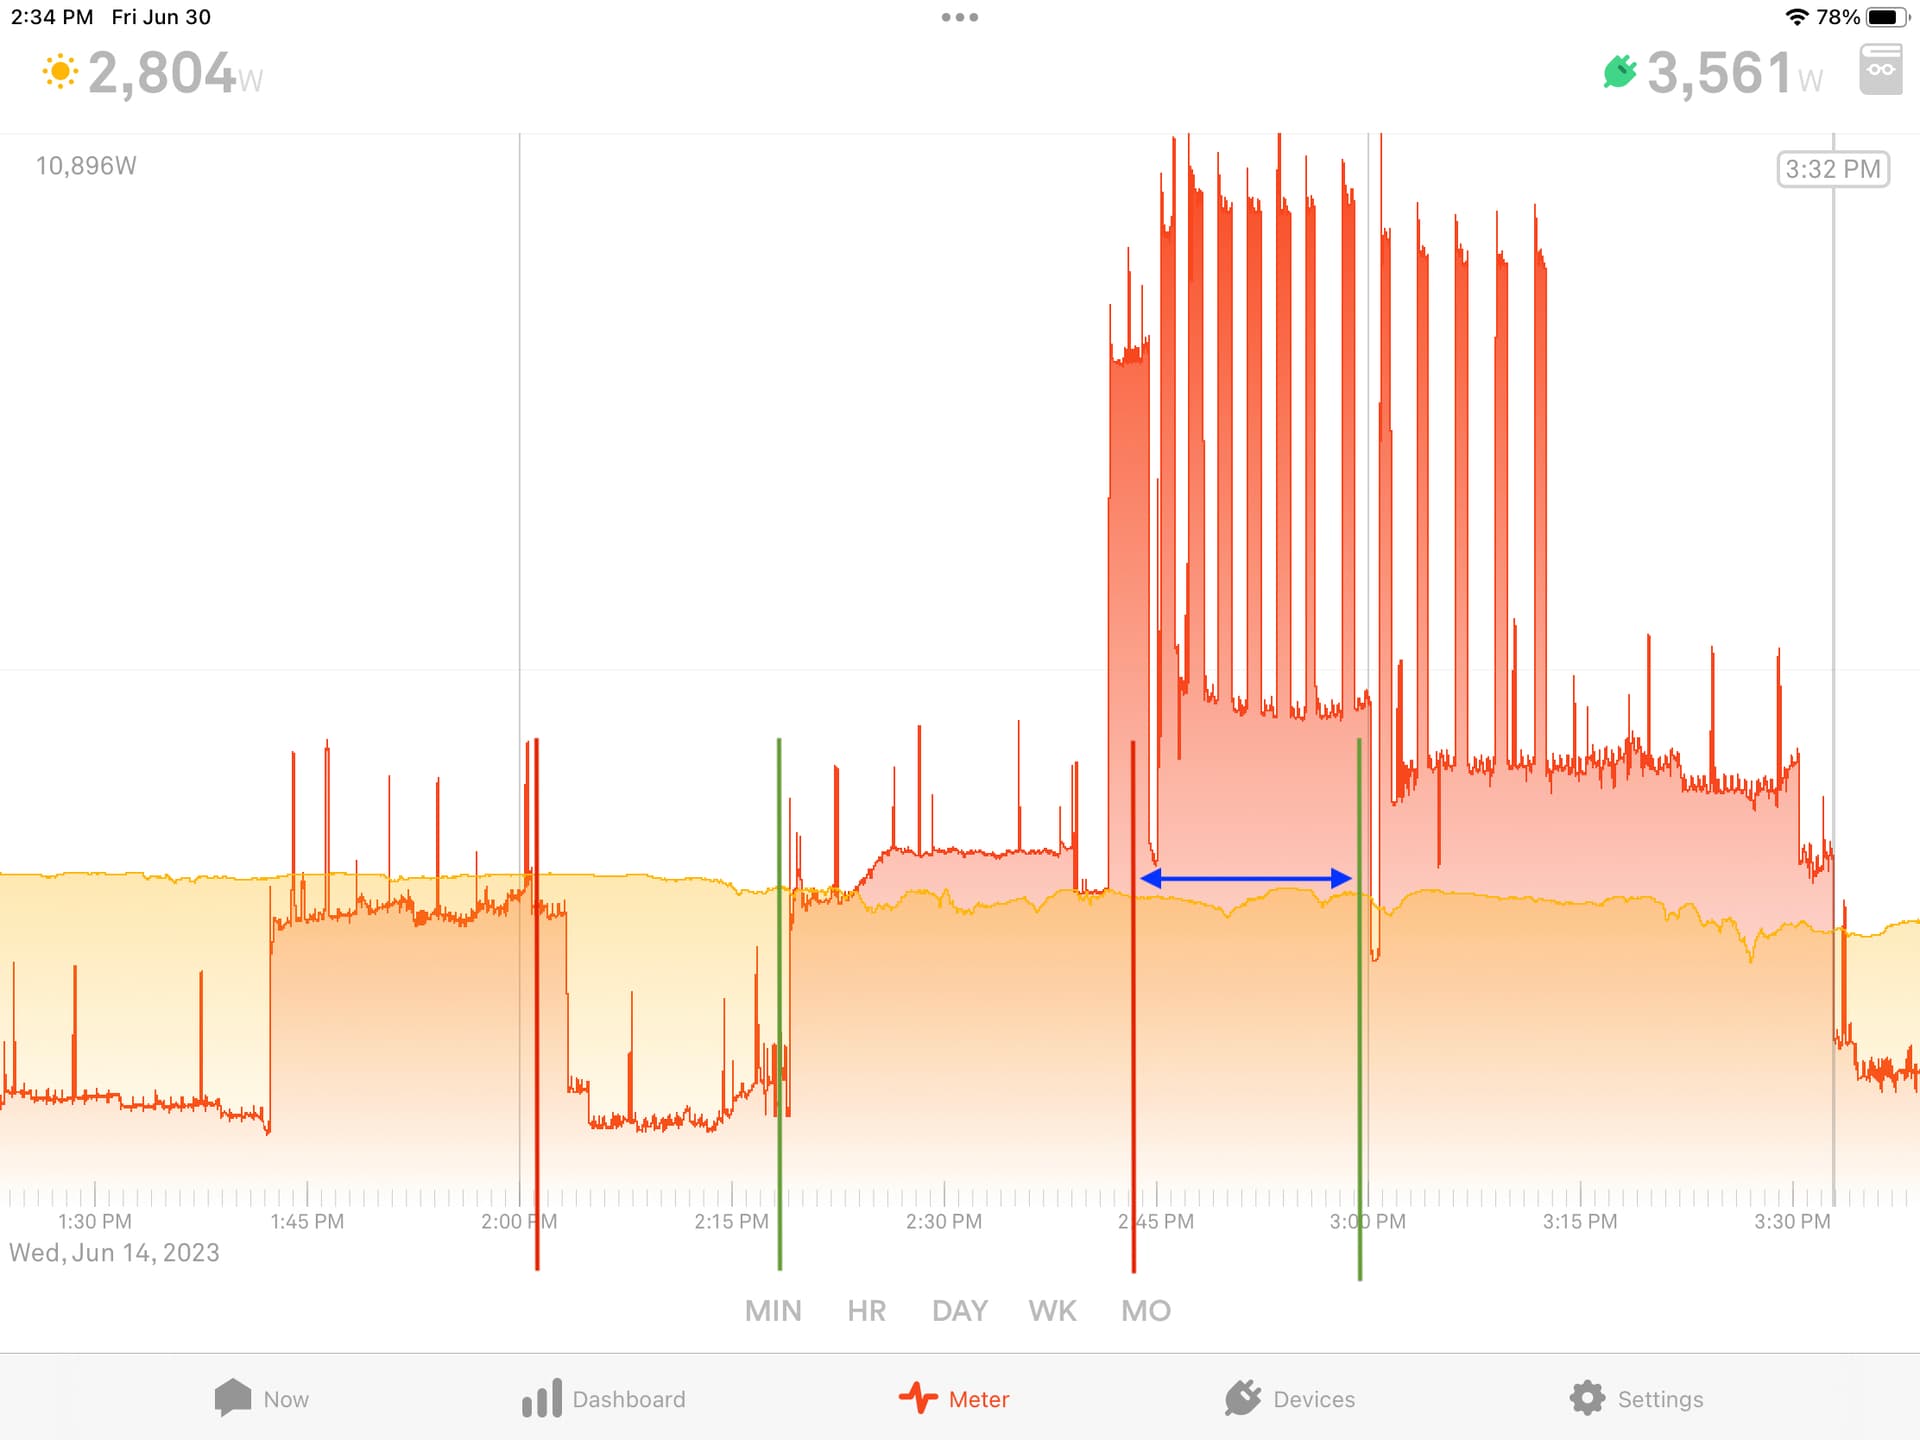
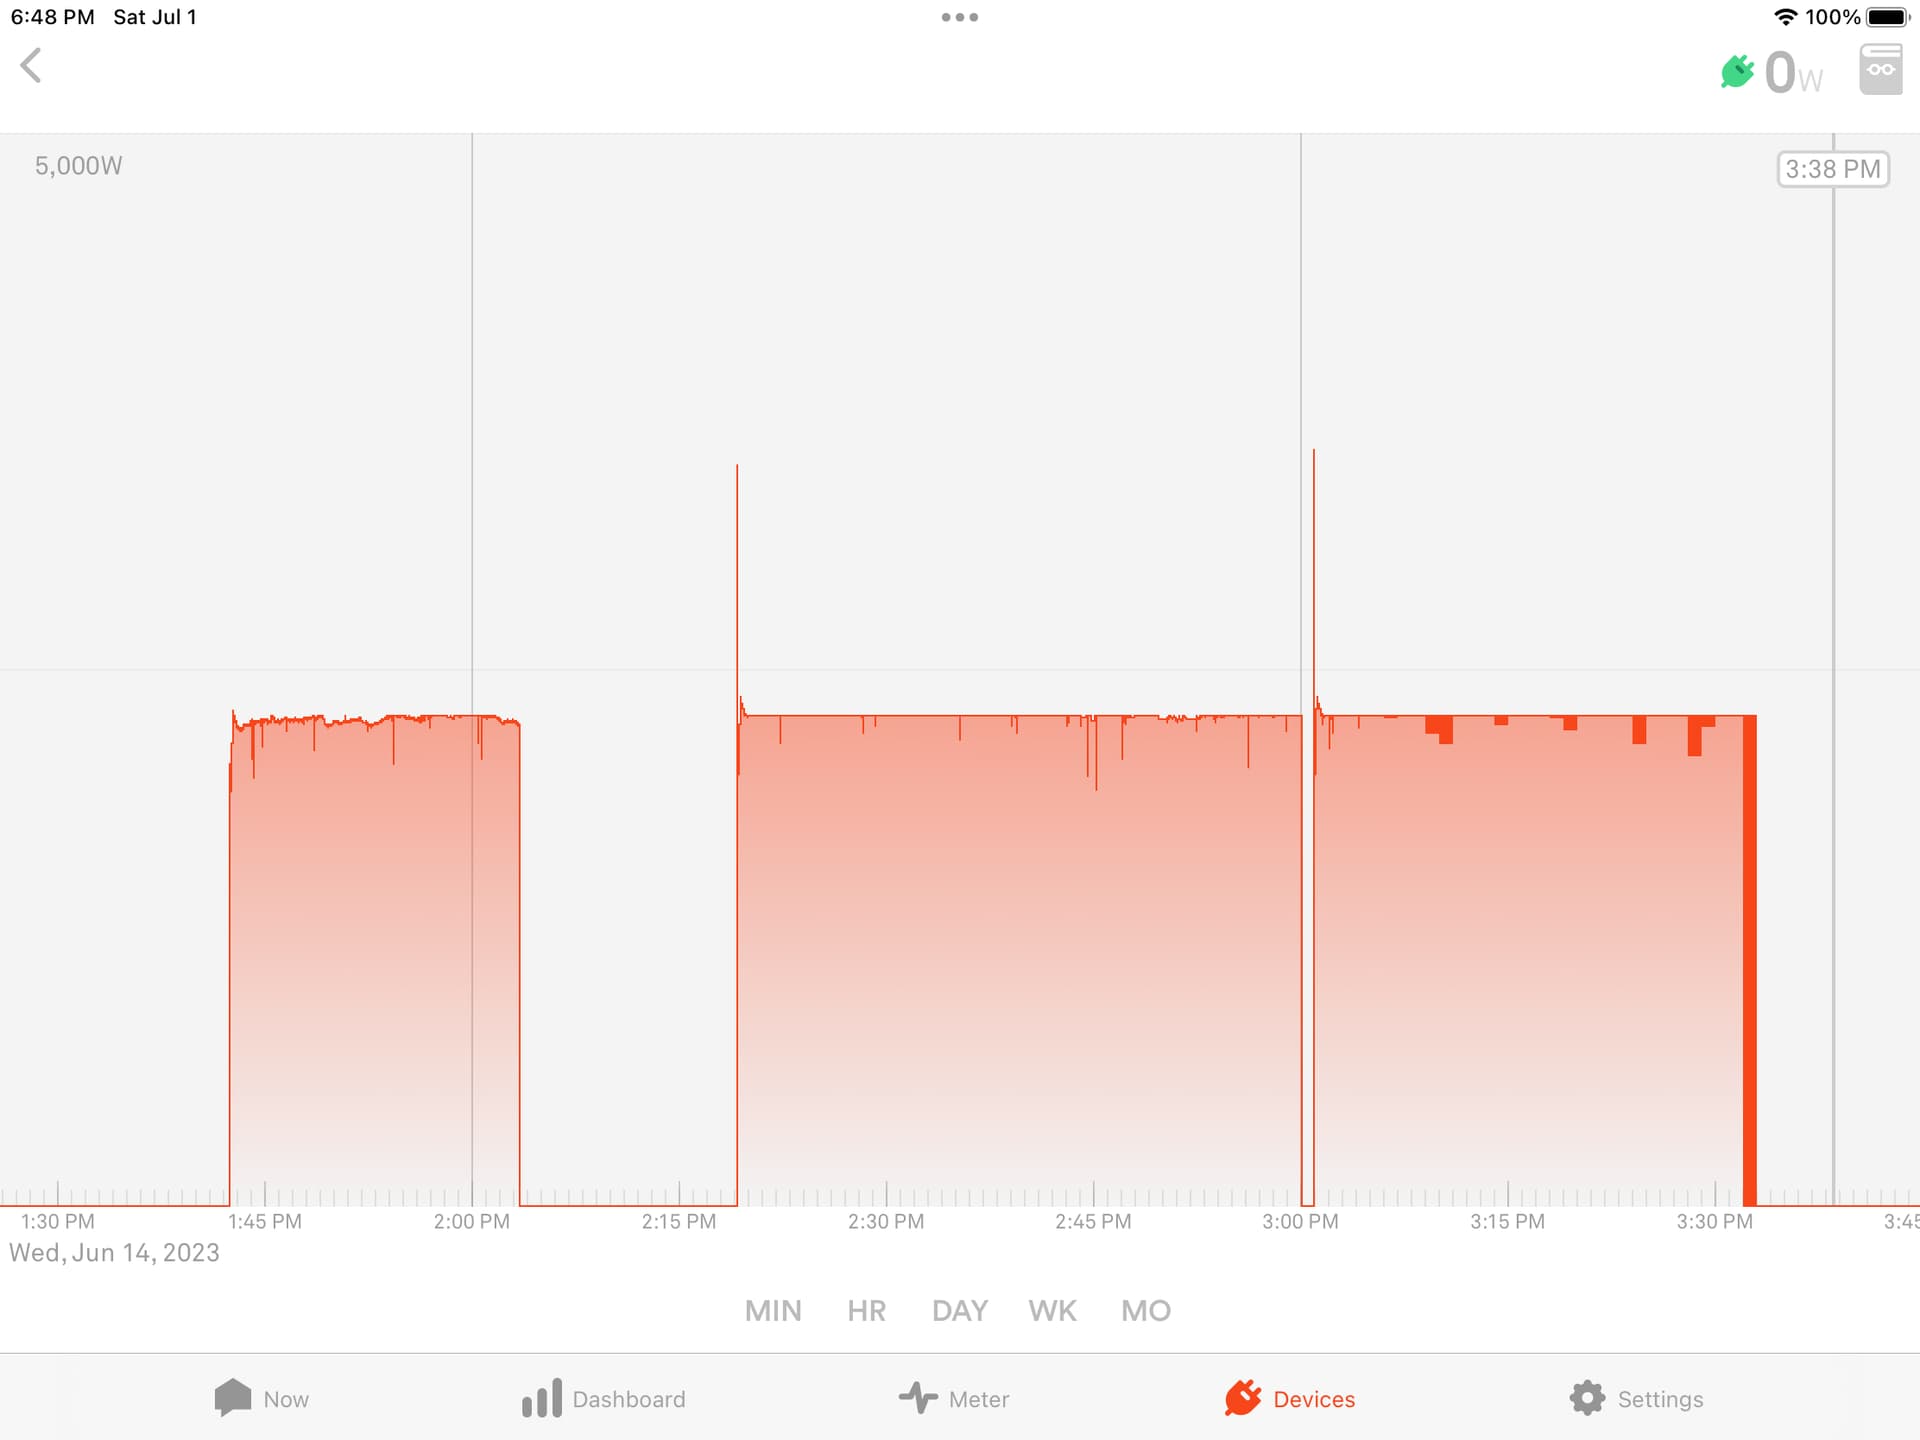
Here’s a time view on the same comparison, with Sense energy in the orange line and Ecobee runtime in the points with point color using the same legend.
If I look at the numbers, I have conflation 5% of the time, and missed detections about 2.5% of the time. The worst case of a miss happens on June 12th where the Ecobee says my AC was running for about 2 1/2 hours over a 3 hour period, but Sense barely registers any usage. That’s consistent with an issue I saw quite a while back where Sense had difficulty with multi-hour AC runtimes.
                 Number of Hours
 Conflation w          Good          Missed
Bigger AC Unit       Detection      Detection
      36                619            16