Based on some recent discussions, I decided to try my hand at forecasting energy usage based on the output of my Sense. Time series forecasting is hot topic in the machine learning world, where past behavior is analyzed to predict future behavior. There are many different techniques that can be applied, but the real trick is matching the technique or model, to the actual behaviors(s) to get a prediction or forecast that is reasonably accurate and doesn’t get out of control (divergence). I’ll talk in technical terms in a later post, but first wanted to share some results to build familiarity to what a forecast looks like.
The way it works is that you capture some data with in a datestamp (ds) / value (y) format for a number of periods that give a good lookback on your usage. The good news is that you can get this directly out of Sense export. With a little filtering, one can pull just the hourly export for “Total Usage” and the timestamp. After that, one can create a model of the existing data. There are many different mathematical techniques for creating a model, but the one I’m going to use first is Prophet, which comes from Facebook via open source. Prophet an additive component model, which means it breaks the historic data down into cyclic components (days, weekdays, months, years) and attempts to size the components to fit the incoming data. Finally one can feed the historic data into the model, then forecast out some period of time using the model.
Here’s the results of using my hourly Sense data with Prophet, looking back to the stat of 2021 and forecasting my Total Usage 300 hours (12.5 days) ahead. The black dots represent my actual hourly usage, the blue line is the forecast/fit line and the light blue shaded area represents the confidence band (80% is the default) for the forecast. You’ll also notice that a large number of 10kWh and above data points don’t live within in the confidence. Those are mostly car charging events that don’t occur on a fully cyclical basis (usually the same period in time of day, but randomly). That’s a downside of an approach that relies too much on cyclicality, but Prophet has ways of dealing with event, like these, but I haven’t tried that yet.
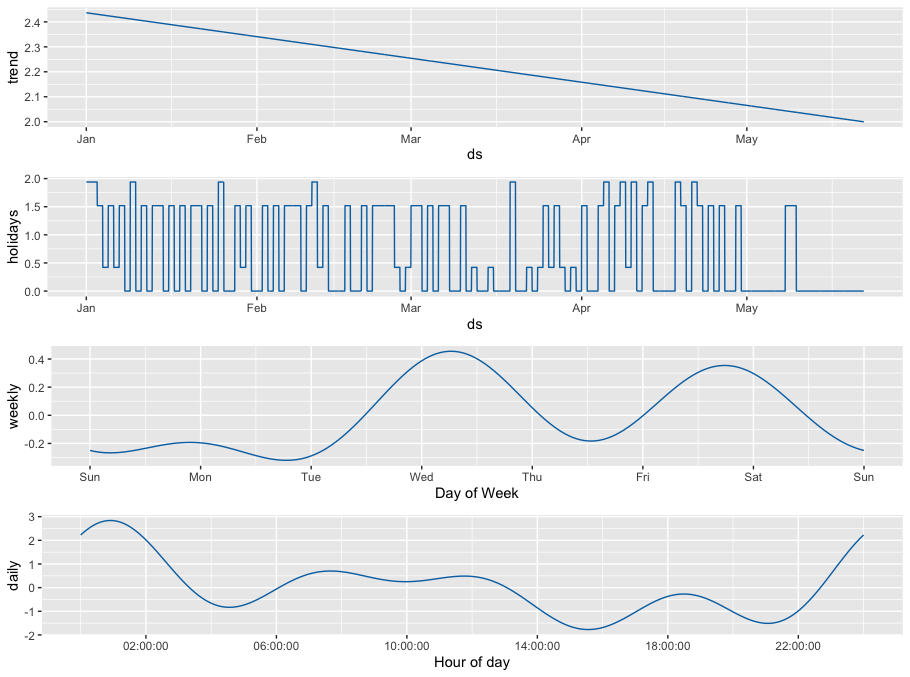
Here’s a view inside the components of model. The forecasted value for each hour is the hourly component, plus day of week component, plus the trend component for that point in time. To some degree, car charging dominates the cyclical components even though there isn’t complete cyclicality. You can see the 1AM bump and the Wed/Sat bump from EV charging.
Very interesting work. Can you tell us a bit about how you might be able to integrate data from other variables, such as outdoor temperature, into your model? I imagine that weather forecasts are one of the primary inputs into grid-scale RTO forecast models, and wonder what’s going on behind the scenes with those tools.
Most of the “standard” data science time series models, like the basic decomposition model, ARIMA and Prophet, mostly look at just the time history of a single measurement to make their predictions. But Prophet does allow the addition of outside regressors (like temperature) and “holidays” to account for influencing factors other than cyclical and trend behavior.
Here’s an interesting example of Prophet being used to look at bike riding in Aukland NZ. One of their later models incorporates weather.
My first try at getting a more realistic forecast, by marking hours where Sense detects the Model S and Model 3 charging, as “Holidays" in the Prophet calculation, was only partially successful. The good news, there are now “Holiday” components associated with charging of each car. On the less good side, the Holiday construct in Prophet has a minus granularity of one day, so if I tell Prophet that one or more hours in one day are associated with charging, the association is for the entire day, leading to smaller components than I would expect.
When I look the details, the Prophet algorithms give a Model S holiday a 1.51kWh (36kWh per day) boost, while a Model 3 holiday boost is only 0.421kWh (10kWh/day)
I’m going to have to try to use try adding Tesla charging as an additional regressor instead, but that comes with certain additional requirements. To get a forecast, I’m going to need to specify charging periods for the future.
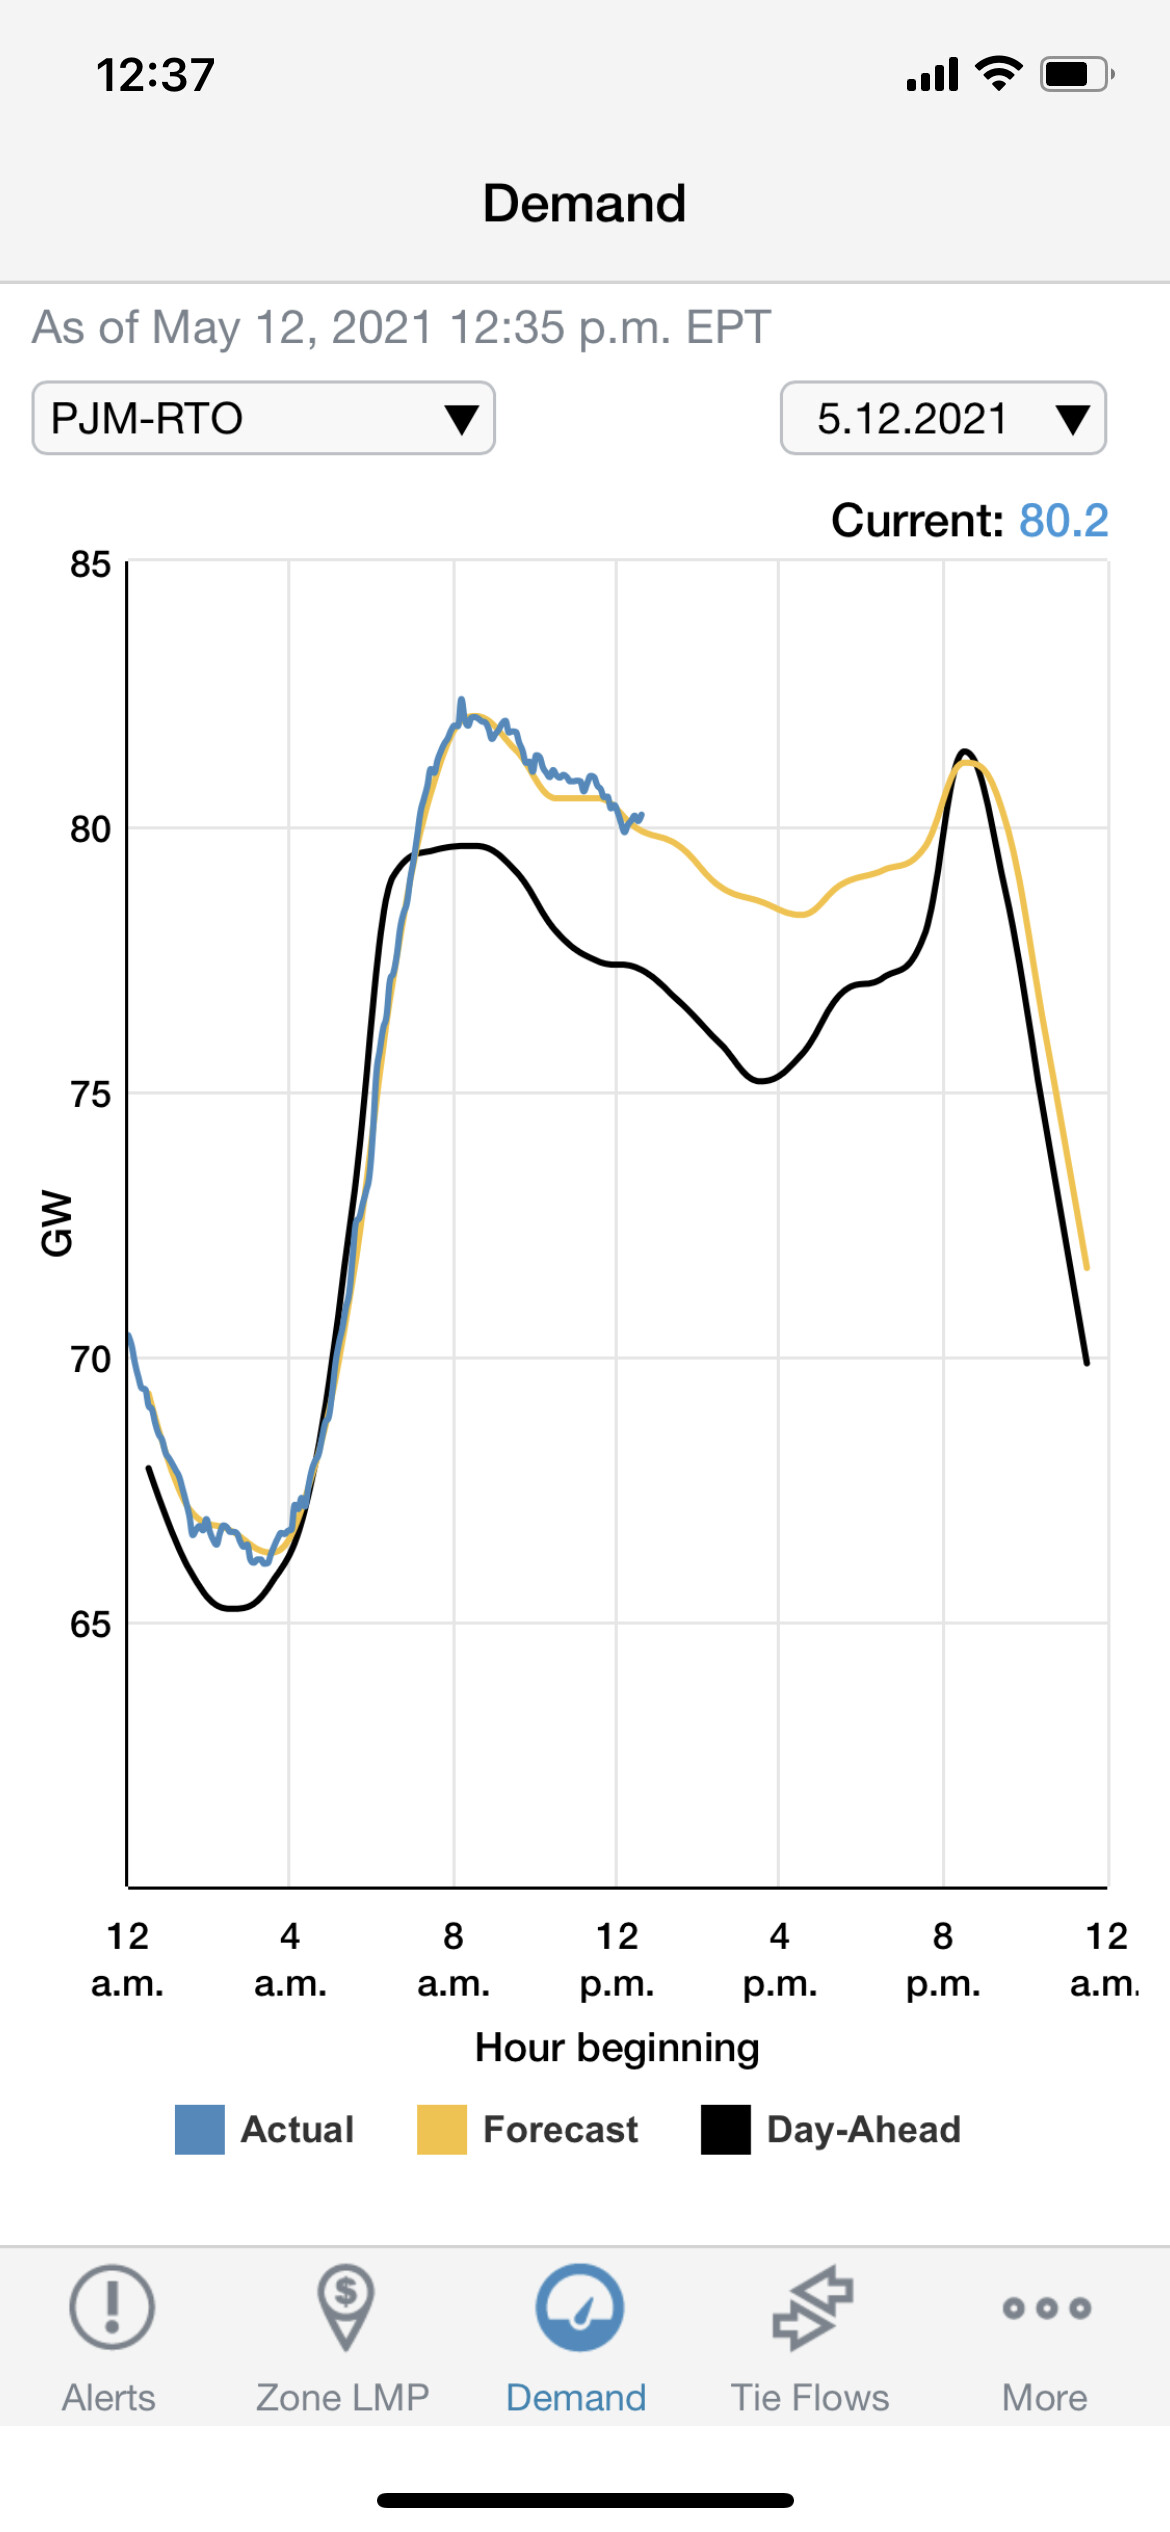
As for grid operators, I do think they have multi factor prediction, but they also can rely rules of aggregate behavior, like the Central Limit Theorem, more so than individual home predictions. I really don’t know how guys like CAISO do it today, when they forecast day-ahead and hour-ahead demand, but there are plenty of papers of researchers trying to do things one better.
CAISO (California Independent System Operator) has a pretty cool website.
I see the DelMarVA peninsula in there. I used to live just outside Philly for a while. Worked for Burroughs when they actually made mainframes (and were called Burroughs)
So after a little work, I have done two different things to my forecasting. I have shortened the historic data interval so I can get a closer look at the predictions, plus I have also fed back in Sense’s total car charging detections (Model S and Model 3) so that I (hopefully) get a better prediction adjusting for the sporadic, but very large, car charging usage. The only downside is that to get a good future prediction when using car charging data as an additional regressor, I have to feed in future expected car charging data. For now I’m going to assume no future car charging (=0). One other comment on shortening the history - The Prophet forecasting algorithm can detect cyclical relationships as long as you input at least two full periods of the cycle, so Prophet can find weekly relationships with 2 weeks of data, though more applicable weeks can certainly help. I say applicable, because unless I’m feeding in data for multiple years, Prophet won’t pick up on seasonal patterns, which means that I really don’t want to be mixing data from winter (floor heating dominated) and summer (AC dominated).
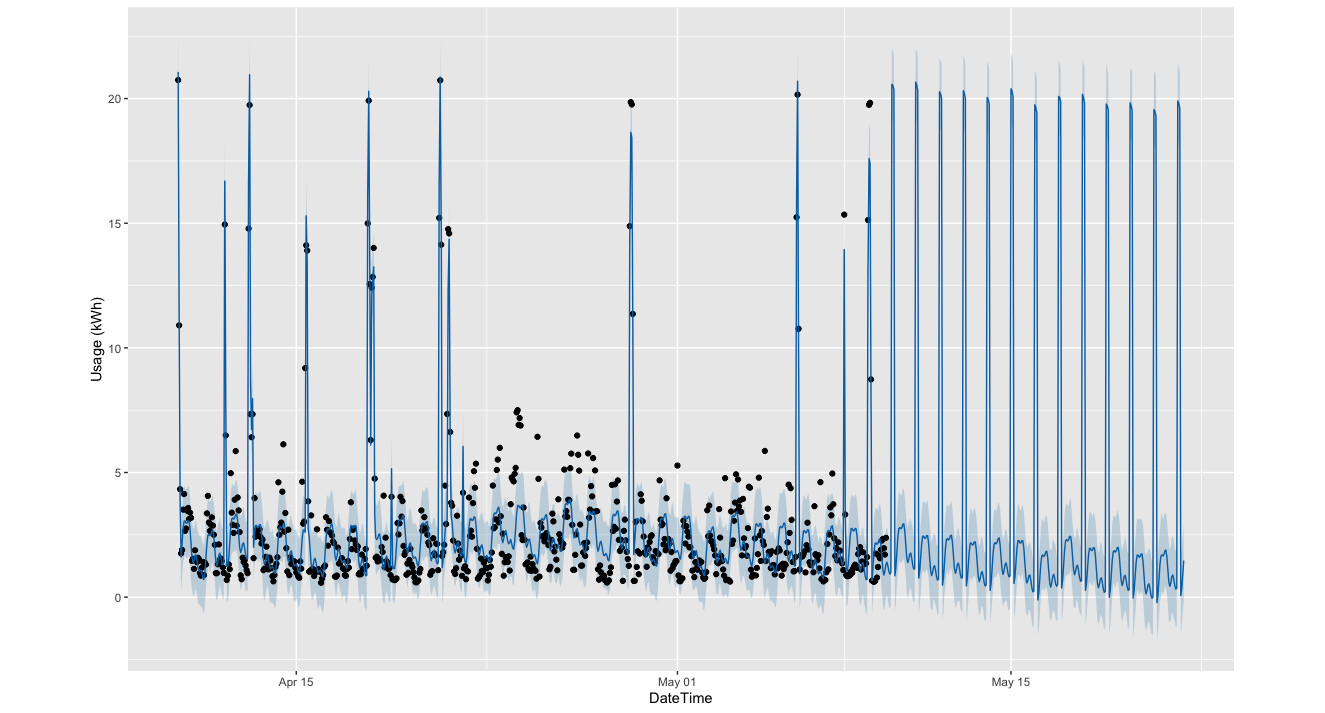
Here’s a closer view of the Prophet prediction (dark blue), along with the confidence band (light blue). You can also see the fit of my home’s hourly total usage (black dots) vs the prediction algorithm. Notice that the past prediction graph now mostly matches up with the car charging data points.
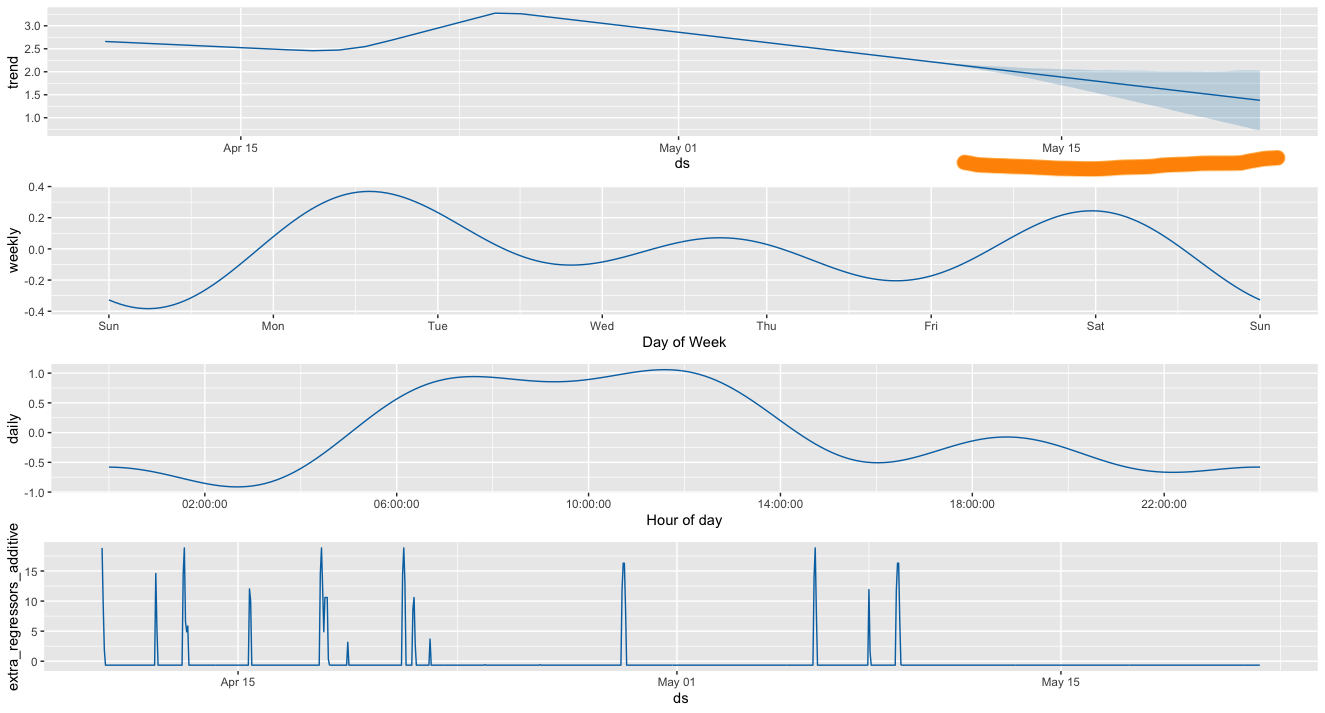
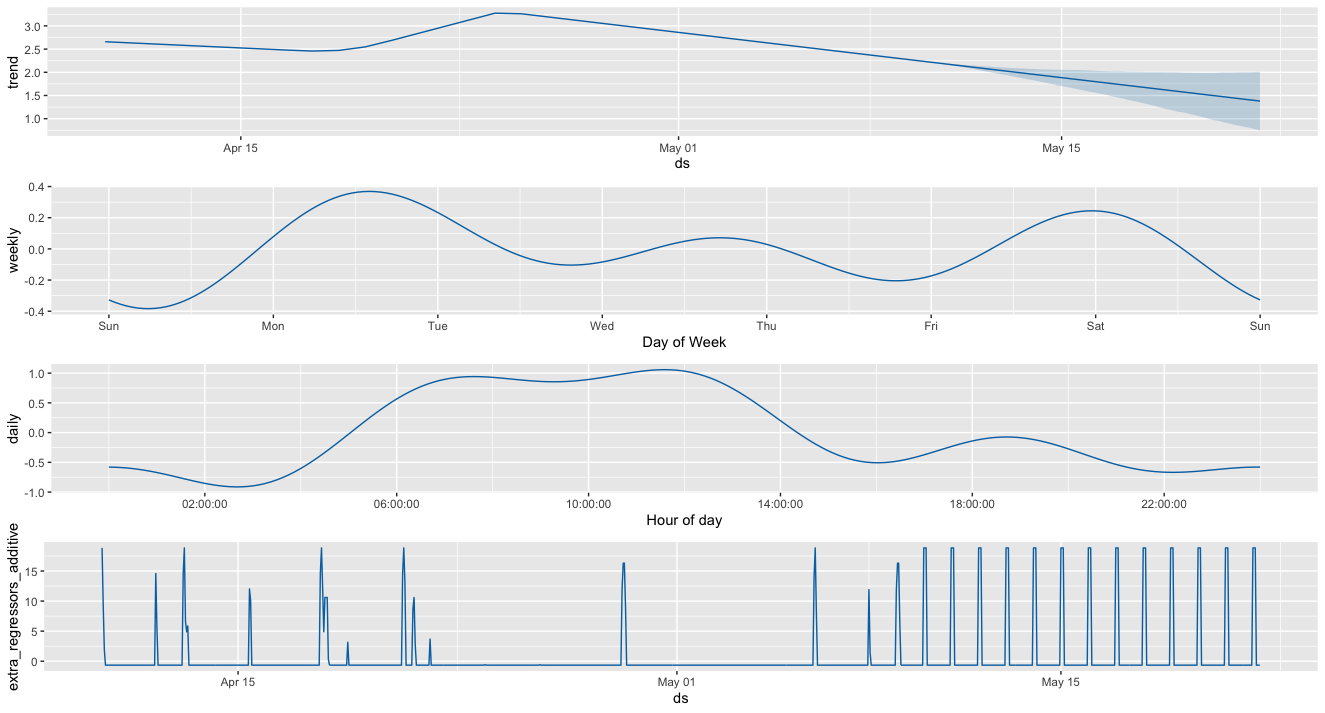
And here’s of view of how Prophet breaks down the computed components for the forecast. You can see how Prophet has picked up on a downward and somewhat unpredictable trend in my energy usage, leading the lower end of the confidence band to go negative. I’m sure this trend in energy savings can’t continue
You might ask yourself “why all the bother trying to predict things”. My main goals are to understand forecasting better, plus to be able to do an accurate, but flexible prediction that I can use to alert me to real, vs. expected energy hogs. For instance, I really don’t care if I’m exceeding my average usage in the midnight to 6AM period as long as I’m not well above my baseline plus my typical car charging energy.
My next step is to try to create a forecast model that fits this bill for the summertime (AC season).
Your prediction work is fascinating! Since the car charging is messing things up, and in fact you are telling it “no future car charging,” it occurs to me that Prophet might work better if you strip car charging from your historical data before you share that data with Prophet. You can probably do your own estimate of car charging in Excel or R using just the principles of statistics, then overlay that on top of the Prophet output.
I like your idea. My ultimate goal is to set up something in my Home Assistant environment that will detect and flag energy anomalies, especially on the high side. To that end, I’m going to try a bunch of things, though I have other things pulling me away recently. A partial list for experimentation, to see which is best at detecting the actionable anomalies:
Prophet with a forecasted EV charging envelope (above)
Prophet with big discretionary usage (EVs, some AC) removed (your suggestion)
Prophet with different combinations of training history and forecast horizons. One big questions is whether it is worthwhile to look at yearly seasonality (AC, Furnace / floor heaters, lighting) or better to rely on localized (2 week history) prediction.
Prophet using hourly data vs. 2 minute data
Other predictive packages other than Prophet. I have looked at simple decomposition and ARIMA so far. Both of them work less well than Prophet.