what a fascinating thread, thanks for downloading, analyzing, and sharing all of your data, I have what is in comparison a relatively simple system comprised of three major components, Heat Pump, Furnace, and Heat Pump electric assist. I find Sense has detected all three but only detects their operation a small percentage of the time. I am hopeful that my recently added EcoBee provides Sense the “ground truth” data needed to improve and that my recently added detail of equipment part numbers and details will help as well.
1 Like
Thanks ! I like having tangible feedback on how well Sense is tracking, and this is the rare case where I can make at least an hourly comparison. I have simple 240V single stage compressors that are easier to “see” than electronically controlled heat pumps of variable speed motors. But presumably Sense can build and test new models more easily with the 5 minute interval data that comes out of the Ecobee.
1 Like
Actually my heat pump is also a simple single stage unit, scroll compressor, fan motor, and reversing valve. Based on the increased cost of variable displacement units when I upgraded the system 5 years ago there was no payback in the higher complexity higher efficiency units for my use case.
All that to say it should be easy for Sense to detect the compressor and fan motor
1 Like
I’m jealous. It is still too early in the year for us so our AC systems have not yet run. The last two years our 2 air handlers and our 2 condensers have constantly been confused with each other. Our downstairs system is ~2.4 ton and the upstairs system is ~3.0 ton.
![]() this year will be better.
this year will be better.
1 Like
Wishing you luck. Mine are Bryant 3 and 4 ton SEER 16 systems.
Updated on 7/24 - added 3 more weeks of graphs
I decide to revisit my AC Sense vs. Ecobee correlation results with a little more of the cooling season under my belt. I had gotten a little concerned since Sense seemed to be falling off in it’s ability to correlate with my Ecobee, especially upstairs, where my AC unit was running far more than downstairs. You can see that Sense’s detection of my upstairs compressor (AC2) dipped for a few weeks, below. The number at the bottom indicates the number of hours that the AC had been running for that weeklong period.

I decided to push a little deeper into seeing what happened during the weeks of May 18 th through Jun 22nd, so I converted Ecobee runtime data into energy data based on my upstairs unit running at about 2.5kW (my unit’s rating - in blue), then plotted against the Sense hourly data for my AC2 device (in red). Sense nailed it during the first week and last week in that list, but had some correlation issues in the middle - what was different ?


In weeks 2-5, it looks like Sense has trouble keeping track of all day runs of the upstairs AC, while it seems very accurate on shorter runs or even all day runs with breaks in the middle. I’m guessing Sense might time out, thinking it missed an off signature after 4 hours of continuous running.
1 Like
I can see where this is going …
![]()
1 Like
Yup,
-
I could use the 5 min Ecobee data to generate 15 min synthesized energy data that I could employ to cancel out AC waveforms in my PGE data stream, as well as synthesizing the air handler as well. That could help simply EV detection, though I would still have to contend with the floor heaters, which have their own thermostat API similar to the Ecobees, but I haven’t cracked yet.
-
I could also use Ecobee data to clean up my Sense AC detections, for purposes of my usage analysis. Looks like on a bad correlation day, I’m missing 10-15kWh of AC that shows up in Other instead. Maybe I should just be synthesizing the new data and replacing. Hmmm.
I have the same NuHeat thermostats I believe but haven’t bothered with the API yet … and now I’ve freed-up a Sense monitor to dedicate to my one floorheat loop. Ground-truth on the ground! Waiting for Winter.
Meanwhile, I wonder if the non-ramped resistive element in the floor heat (= predictable plateaued load) isn’t somewhat “easy” to synthesize and cull … at least statistically. I suppose you’ve pondered that. Maybe I missed that in your prior work. You’re good at histograms!
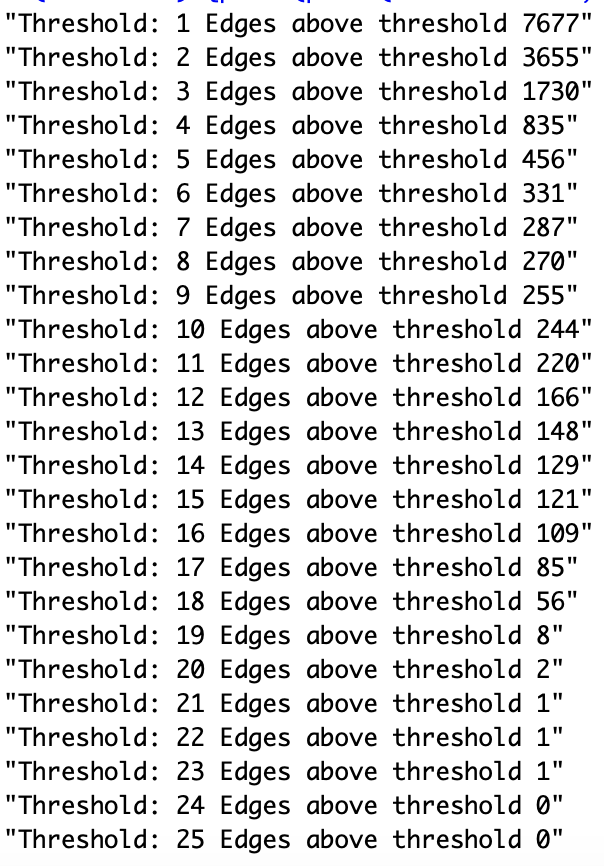
If I had a tighter sampling interval than 15 min for energy, I probably could, but based on quick analysis the population of spikes goes up too quickly for continued use with my simple matching algorithm once I get past a delta threshold of 5kWh. I did a simple analysis here - number of candidate edges double with each 1kWh decrease in thresholds. There’s kind of a sweet spot about 5-6kWh that is pretty much occupied by just EVs.
I am going to do a more complex statistical analysis of deltas, Total Usage, neighbors within different window sizes, to see if some kins of smarter matching is possible, but right now, I need more distinguishing features than 15 min delta and Total Usage, to pair up ons and off of spikes above 2kWh hours, where most edges for the heater and AC lie.
1 Like
I decided to take one more deep look at detailed correlation between my Ecobee runtimes and my Sense detection for my upstairs AC compressor (AC2) to see what things look like when Pearson correlation between the hourly usage is good (very close to 1.0) vs. bad (less than 0.7) on a weekly basis. Here’s the weekly correlation chart between hourly energy usage and Ecobee hourly runtime. The numbers on the bottom are the number of hours that the downstairs AC ran that week at about 2.15 kW / hour (3 ton unit). One of my motivations for a more detailed look is that I just replaced my evaporation coil upstairs, as well as the furnace, including the blower/air handler for my AC. I want to see if I see any differences in performance.

First, let’s look at good correlation for the week of 6/22. Here’s the week view on an aggregated hourly basis. Looks quite good except Sense seems to have missed an off-signature or 2 on June 26th.

Is there any way to get a better idea what happened there ? Maybe if we look at hourly Sense vs. Ecobee’s 5 minute runtime data below. Then again, maybe not. Given the number of actual on/off cycles, it’s hard to resolve the Sense hourly vs. the full set of transitions. Also makes me aware of how important it is to line up sampling intervals when doing visual comparisons. For the nerds out there, your simple AC system is run by pulse width modulation (PWM).

Now it’s time to look at far less good correlation the week of June 8. Very clear what the main mode of failure was here. Sense either detected an errant off-signature or decided to time out after what looks to be about 2 hours. June 10th and 11th were a fairly abnormal heat spell where the upstairs AC was pressed to run for 12 hours continuous.
Hour by hour:

Sense hourly vs. Ecobee 5 min.

A final look at one more errant week, May 25th. Looks like the same phenomenon - Sense seeing an off too early on days when the AC is running for uninterrupted for long periods, though Sense looks like it hung in there for much longer on May 25th. I’m wondering if Sense occasionally trips up on my upstairs off-signatures because it interprets an off-signature on my larger downstairs AC unit as its off ? Maybe work looking closely at one of two of these mistaken off events.
Hour by hour:

Sense hourly vs. Ecobee 5 min.

If I push down into 4 days where Sense seems to lose the AC2 (upstairs AC compressor) detection too early, when my Ecobee is trying to run the upstairs AC for many hours, I can add what my upstairs Ecobee is doing in black and my downstairs Ecobee in orange lines. What I see is that there is a lot of on and off activity on my downstairs AC when my upstairs Ecobee is calling for the the upstairs AC to remain on. Given the proximity between Sense losing the AC2 detection and my downstairs AC turning off, there is an extremely good chance that Sense misread one of the downstairs off-transitions as an upstairs off-signature and ended the detection.


1 Like