My voltage graphs are not updating. Is anyone else seeing the same issue?
Current time is: 8/26/2022 12:19 PM CDT
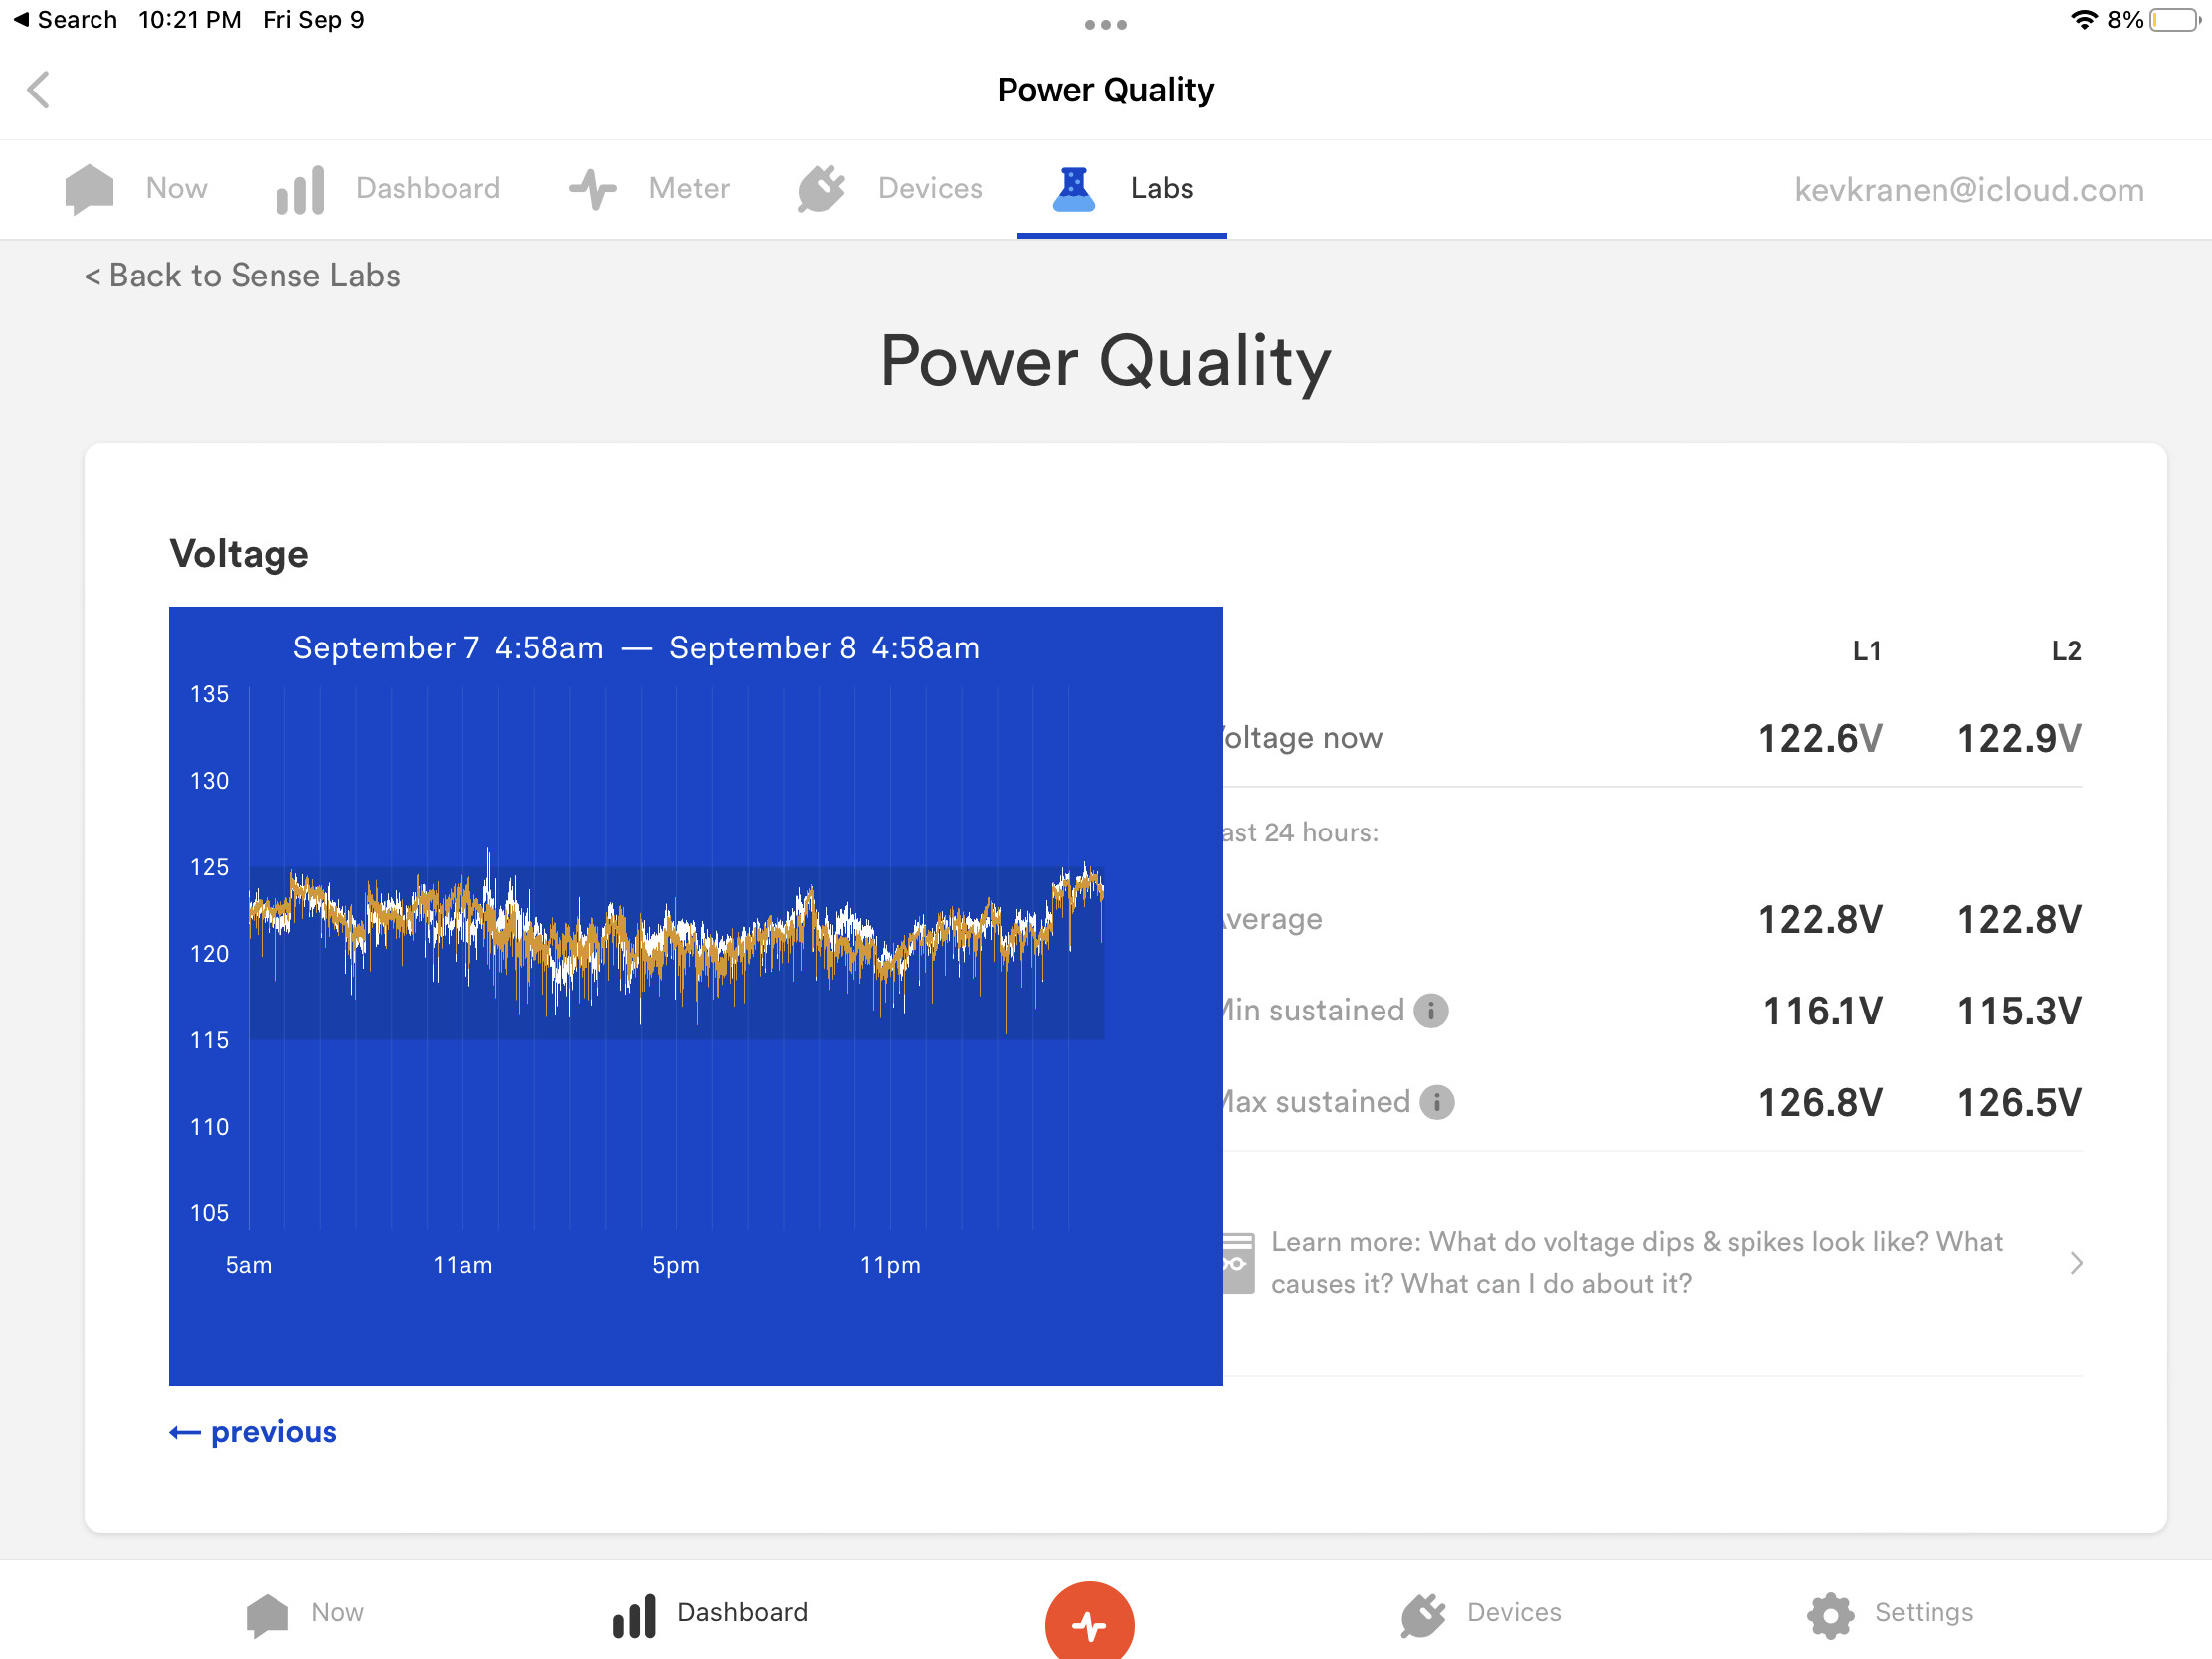
Voltage graph : 8/22/2022 5:58 AM
My voltage graphs are not updating. Is anyone else seeing the same issue?
Current time is: 8/26/2022 12:19 PM CDT
Voltage graph : 8/22/2022 5:58 AM
same here, stuck on Aug 21, 8:59am to Aug 22
Yup - mine’s back on Aug 21-22nd as well.
Thanks for flagging this @Dcdyer. I am seeing the same thing on my end. I’ve passed this along to the team for triage.
I was told by support that it’s completely normal for graphs to only update 1-2x per week and could be much longer at times as it’s a labs feature. Lab features are previews and not fully implemented features of Sense and to be expected.
I had a significant power event on Saturday morning, 8/27/22. Do you know if this data will eventually populate? I understand that this is a Lab feature but it is also the sole reason I purchased this product.
Mine also is back to August 22nd.
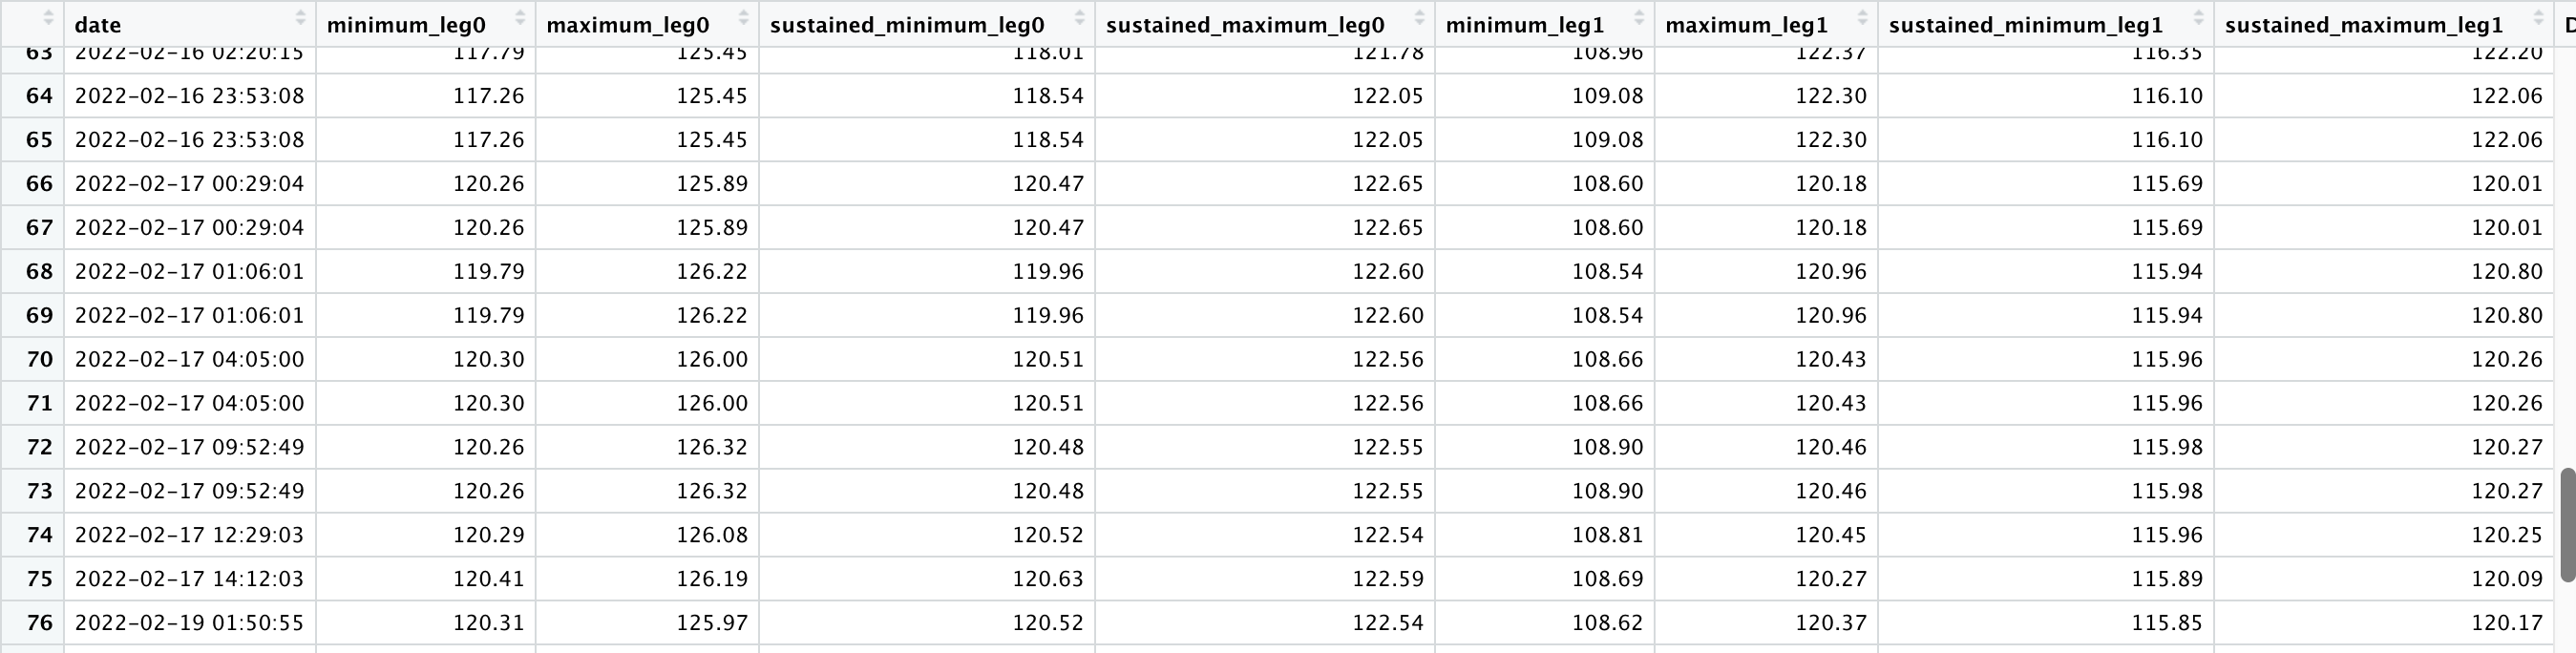
@Dcdyer , I would suggest doing a download of the .CSV for these dips. You’ll get a little more info about exactly when in the minute they occurred as well as all the other readings at that point in time.
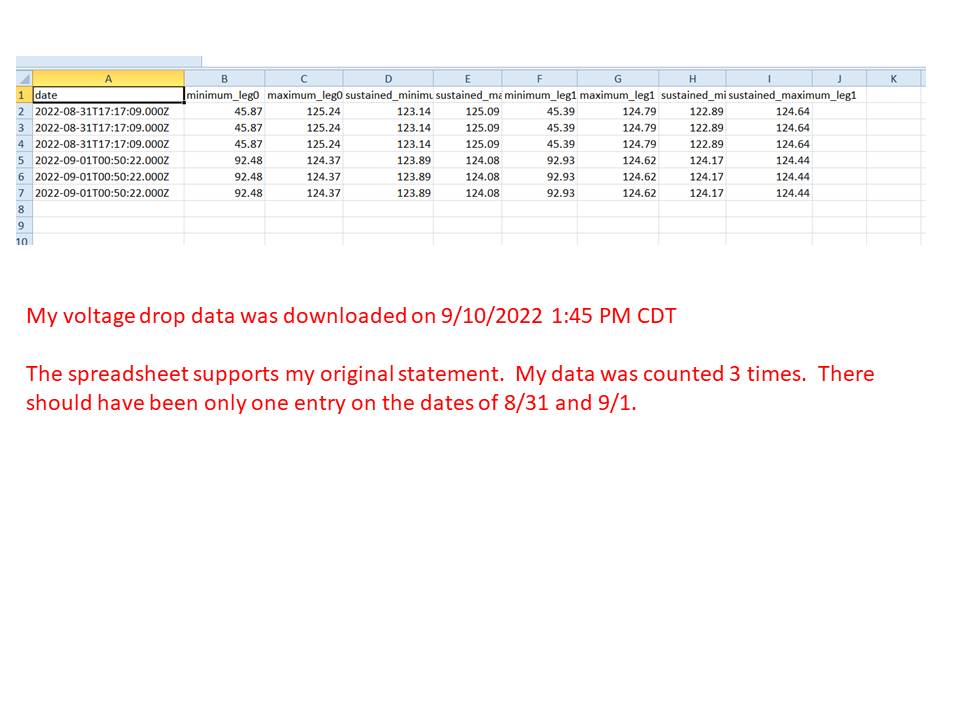
ps: I have seen some previous (months ago) cases where Sense double counts a dip, even in the .CSV. This is from another user’s data in March 2022. You can see the duplicated rows - they occurred in the middle of a bunch of data that did not have duplicates (all the events were spaced out over time).
Thanks for sharing. I think you are right - duplicated entries are something that Sense should filter out. At the same time, those voltage numbers are NOT direct measurements, but rather an RMS calculation based on (hopefully) at least one 60Hz cycle of voltage data. Depending on RMS calculation method used, each data point could rely on tens of thousands of raw voltage measurements over less than one second. So there is a chance that a detector might see multiple events within one second.
Think about it - this is what the real underlying waveform might look like to Sense. How many dip events is this ?
I pulled it from a paper describing new techniques for estimating sag.
Original problem has returned:
The Voltage Graph ‘picture’ updates are not current.
Current time is: 9/12/2022 12:29 PM CDT
Voltage graph : 9/08/2022 2:58 AM
Are any other users seeing this problem?
My voltage graphs are not updating, though I just installed the system on Friday, so I attributed it to new user - system lag. I have yet to receive any voltage data beyond the live numbers.
Mine has advanced to Sept 10-Sept 11. A couple days behind.
My data -
Current time is : 9/13/2022 11:30 AM CDT
Volt Graph date: 9/11/2022 8:58 PM
Apparently, the BATCH program has been restarted.
Mine continues not to update… the mystery continues.
Any changes yet ? Mine has now updated to show 14th to 15th.
My data -
Current time is : 9/16/2022 2:15 PM CDT
Volt Graph date: 9/15/2022 9:58 PM