To: @JustinAtSense @EmoryAtSense2
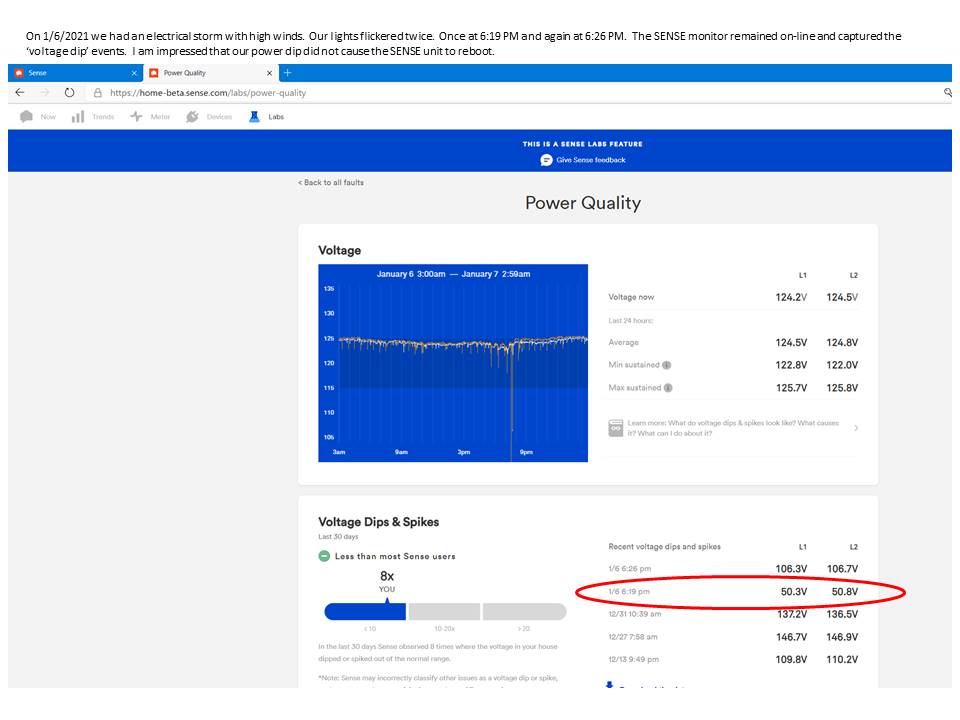
Is there any news on why a ‘voltage surge’ on my earlier post did not show on the graph?
To: @JustinAtSense @EmoryAtSense2
Is there any news on why a ‘voltage surge’ on my earlier post did not show on the graph?
Sorry, was waiting on a response from a few folks that were out of office the week this came in and just coming around now. I’ll have a more definitive answer for you tomorrow on why this voltage spike wasn’t showing in your graph.
Thanks for pinging this @Dcdyer
We found the spike in the data and initial suspicions were that because the spike was so brief, the graph smoothed it over. Originally we thought this was a Data Science issue, but after investigation we found it’s due to how the JSON-generated graph handles brief outliers in the data regarding to “smoothing”.
One of our developers will be looking at how we can better handle these “brief outliers” and handle them uniquely for these cases. Moving forward, your reported “Spikes & Dips” are reliable sources and will include these “brief” spikes.
Hi every one what steps should I follow to identify what is causing such a bad energy quality in my home
Start by going to the first entry in this thread. Suggestions are listed in the first blog.
Hi everyone,
So I didn’t know this came out. I haven’t had much time to play with Sense lately. This morning I was looking on the online dashboard and came across this and was amazed by the amount of voltage dips and spikes I have as you can see below. We’ve been working at home and I’m on my computer pretty much all the time. At least once a day if not more my UPS kicks on for just a second and now it makes total sense why that’s been happening.
I’m extremely surprised that we’ve had this many dips even down to 90v and kinda worried about that. Any suggestions? Is this something I contact my power company? I’m extremely proficient with electrical work and have no problem opening up a panel or anything else, but dont really know where to start with this.
And apparently I’m not able to post images or links in my post. How do I fix that? I’d love to share what I’m talking about.
If you want to look the Imgur image link code is UgEdlaj.
I am editing your permissions now so you can post images.
2 posts were split to a new topic: Power Quality - Transformer Replacement
would be nice to have a notification feature re this… more real time vs waiting until your log in
A post was split to a new topic: Power Quality - Issues after a big storm
Power Quality - 12 dips reporter but I really can’t make sense of this and what it means.
Also I think I should have received a notification based on the Exclamation in the Labs section instead of me poking around on my own finding it.
Justin… tried to upload some jpg files, but system, says I cannot embed media. Is that an access thing or am I doing it wrong?
It looks like your graphs are out of date. This appears to be an issue for a few people.
Check out this thread
3 posts were merged into an existing topic: Power Quality - Transformer Replacement
It would be great if we could get a timeseries graph of voltage data, similar to the meter screen or an overlay to it.
I have experienced a few voltage spikes here resulting in GFCI outlets\breakers tripping. The labs feature has recorded a few of these but others seem to slip through and it would be helpful to be able to visualize the voltage flucuation.
A great feature in any case and has been helpful in maintaining my sanity and not spending a fortune on electricians to chase ghosts.
I recently set up Home Assistant on a new Raspberry Pi and it seems to keep historical voltage data if you enable Sense integration. I haven’t had it set up for more than a day, though, so time will tell.
Might be worth a shot if you don’t want to wait. It also shows device status and a few other things.
3/28/21 Update: We’ve added the ability to look back up to 14 days of historical daily graphs in the Sense Labs: Power Quality project in the app and web. You can now browse graphs from up to 14 days earlier by clicking “Next” or “Previous” below the Power Quality graph in Sense Labs.
This will be live for users in the next several hours.
I don’t see it yet. How long until it rolls out?
This should be live with no update needed. Are you on Web or Mobile?


