- ( Link ) - 2018 Historical Reports
- ( Link ) - 2019 Historical Reports
- ( Link ) - Historical Actual Reductions
- ( Link ) - 2020 January
Goals :
- Always On - <90 watts
- Average Daily Usage - <15 kWh
Goals :
Nice job dropping your always on. How did you identify always on items? Did you walk around pulling plugs or flipping circuit breakers or is there another approach?
This is worth reading in order to understand how Always On (AO) is calculated
As far as discovering AO devices, the best method is possibly one of common sense and won’t often involve flipping breakers:
A fridge is literally always plugged in, and so has an AO component but you don’t want to pull the power on it or flip breakers necessarily. Putting a fridge on an HS110 smart plug is a great way to track that power since devices like that can be particularly difficult for Sense.
Most truly always on devices that will register 100% of their load in the AO number are going to be small wattage devices like modems and network gear. And Sense for that matter!. Listing out your devices like that and looking at the specified wattage is probably the way to go. You can also put those on a smart plug but that’s overkill in most situations. Consolidating those devices using a dumb power strip on a single smart plug is a good tactic.
Devices like an HVAC system that has an always-on controller board or a TV or AV device that is left in standby mode are other candidates for easily accountable AO.
A “Tester” smart plug is very handy for tracking and accounting for AO: A modern “wall-wart” transformer will use very little power when “just plugged in” but there are still many wall warts that can suck power when not doing anything (like a charger). Give them some time plugged into a “Tester” and you’ll see precisely what’s going on.
Thanks, good advice. Maybe I will pick up an HS110 smart plug for the refrigerator but is there a setting on the smart plug so it never shuts off?
The HS110 will come back on after a power failure.
You can also deactivate the Sense app smartplug switching function so you don’t inadvertently switch it using the app.
My always on consists of appliance electronics, Uverse modem, a router, MyQ and Smartthings hubs, a few smart plugs (turned off unless I want to use the device), a clock radio and landline base phone. I unplug my TV and turn off the computer through a rack mounted surge protector when not in use.
Although I have some smart lights, I usually switch them off manually when I’m not showing off the functionality to someone. I did not go through any process of identifying all of the above. That’s really everything I have plugged in!
I’d say I live below my means in an environment slightly better than someone who is homeless. It helps that I like my place dark and cold. I’ve never turned on the heat since I purchased the place in 2004. My Nest thermostat only serves as an analog clock!
I truly can not lower my energy consumption from here!
Kevin…
My Goal: Leverage automation to maintain below an annual (5,500 kWh) electrical footprint
Your non-solar energy-footprint continues to motivate me to remain focused, upon my own annual energy objective! I use your outcomes, along with the reportings of other diligent non-solar Sense-users - as guideposts for my interim goals. Sense is my baseline cost-saving smart technology tool!
I’m giving some comparative thought of your single-occupant 1,246sqft San Diego townhome environment, against my dual-occupant 3ksqft, Northeast Ohio single-family home. Although our methods and motivations are not comparable, our outcomes are undeniably similar!
Your minimalist-approach has merit and strengthens your likelihood of a superlative 401K!
Going to be interesting to see the Corona virus impact for next month. 100% work from home means heat is on but not driving 130 or so electric miles. I’m betting our usage is less than same period last year.
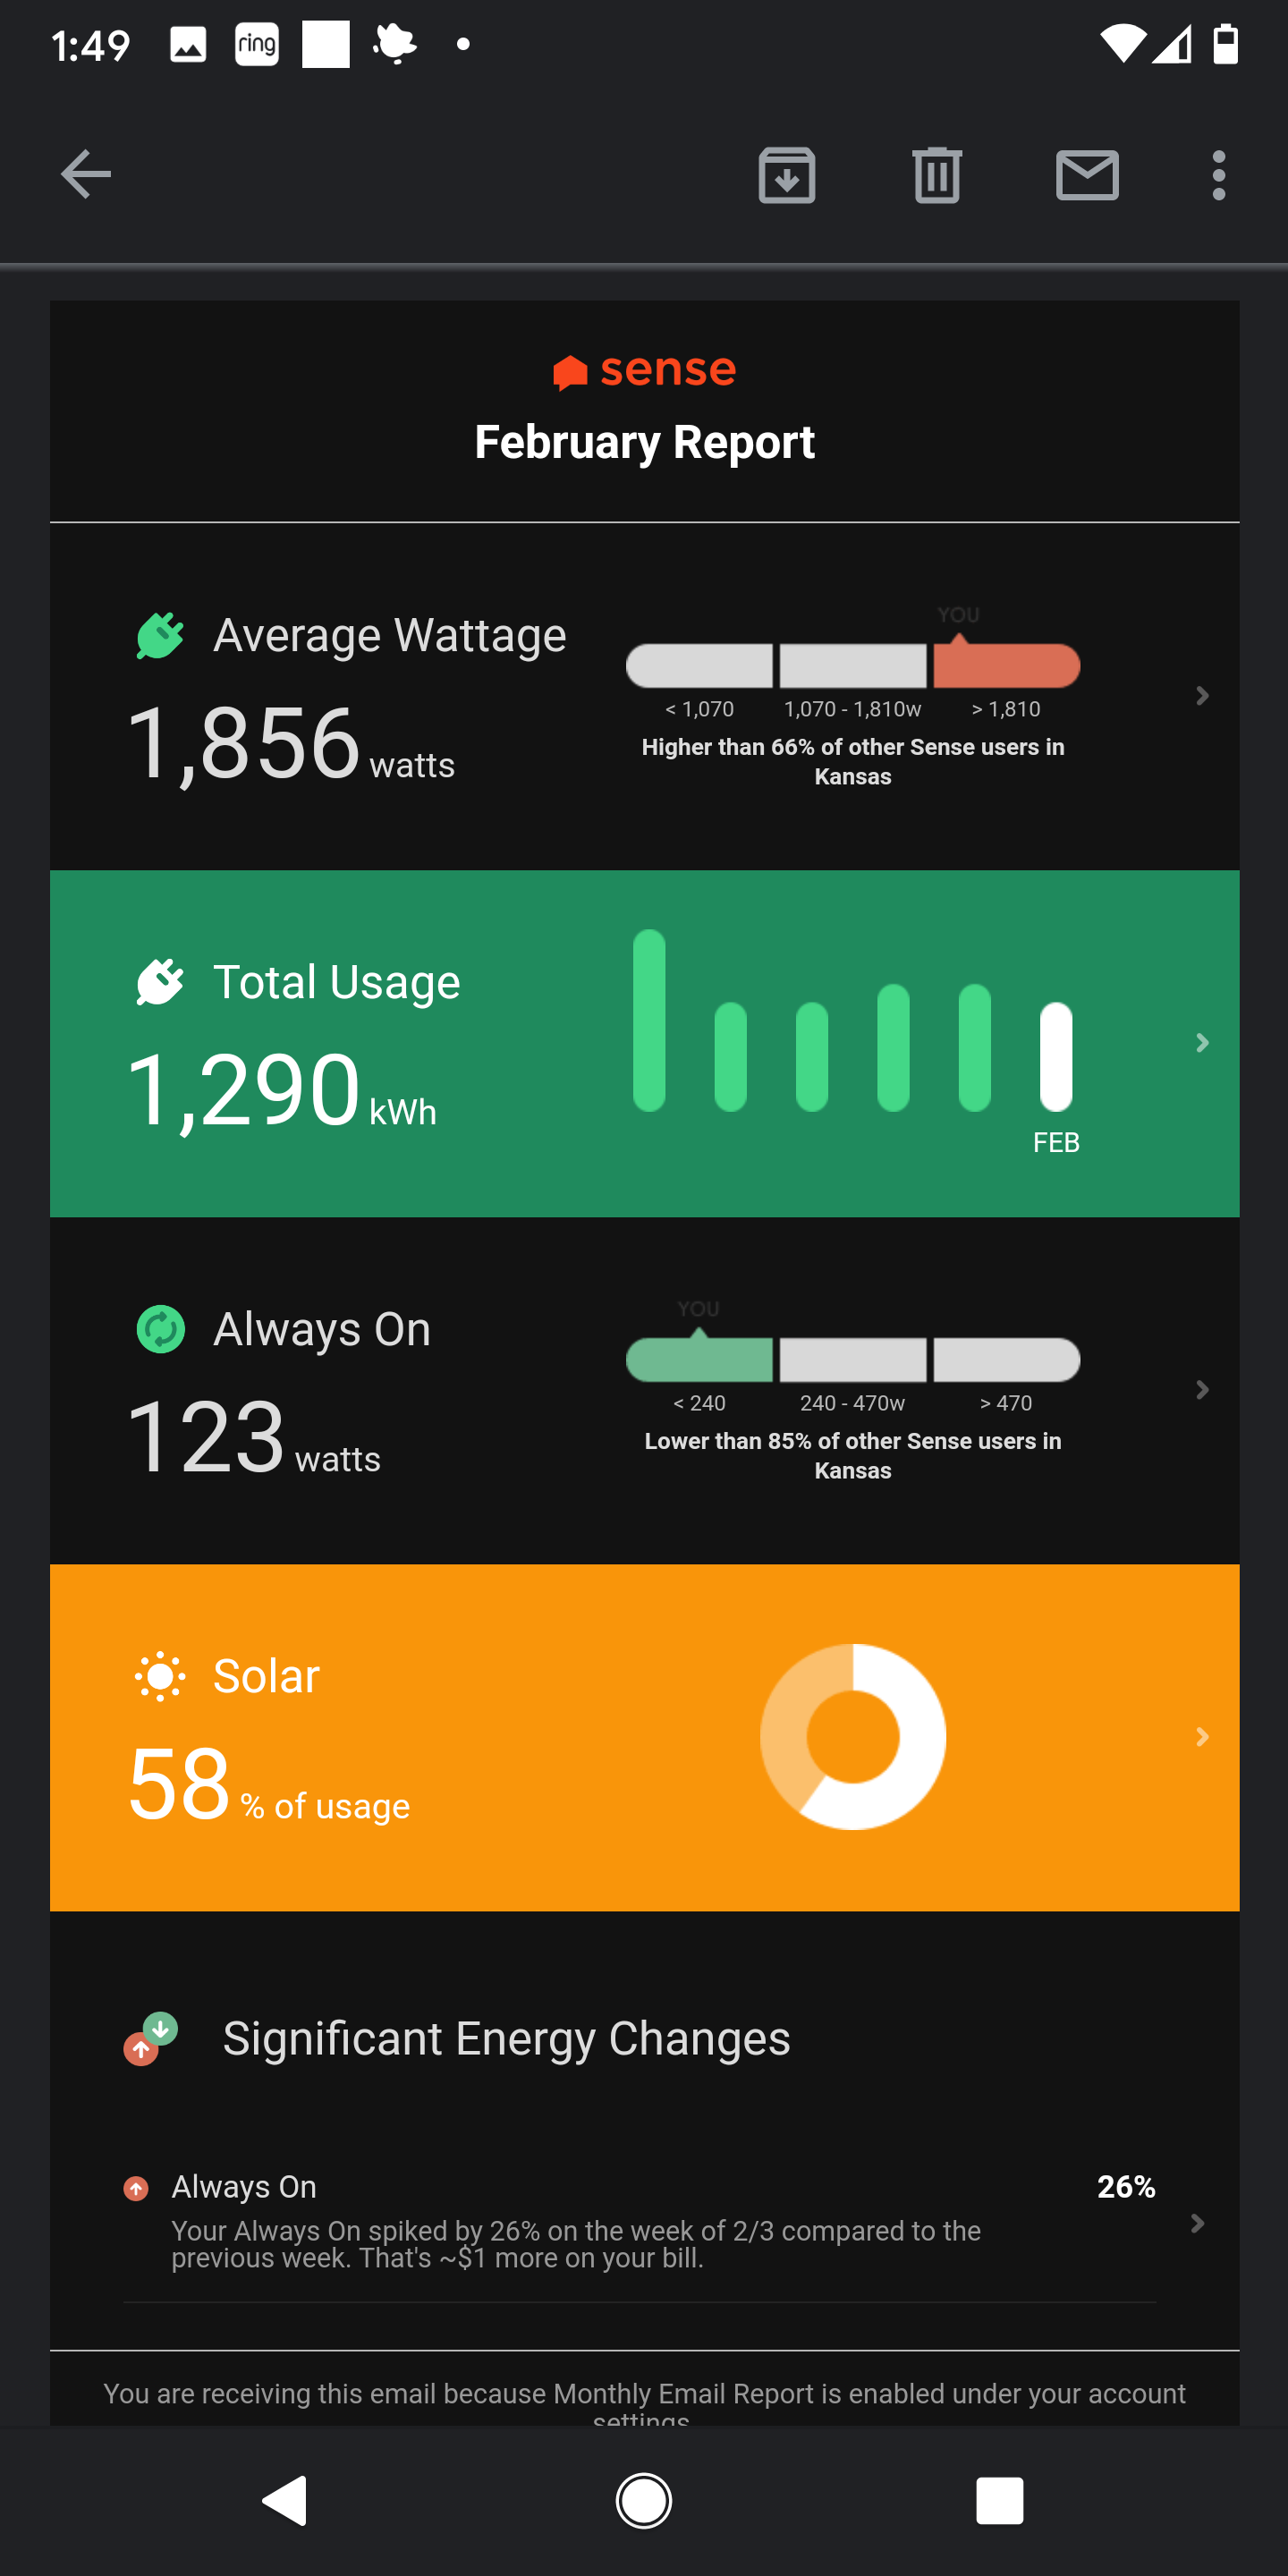
Right on time this month!
My usage has dropped to a new all-time low only because I was gone for half the month. The refrigerator was the only device which was turning on in those two weeks. I guess you could say I have dropped my Always on by 1 watt, as it’s consistently 54 now.
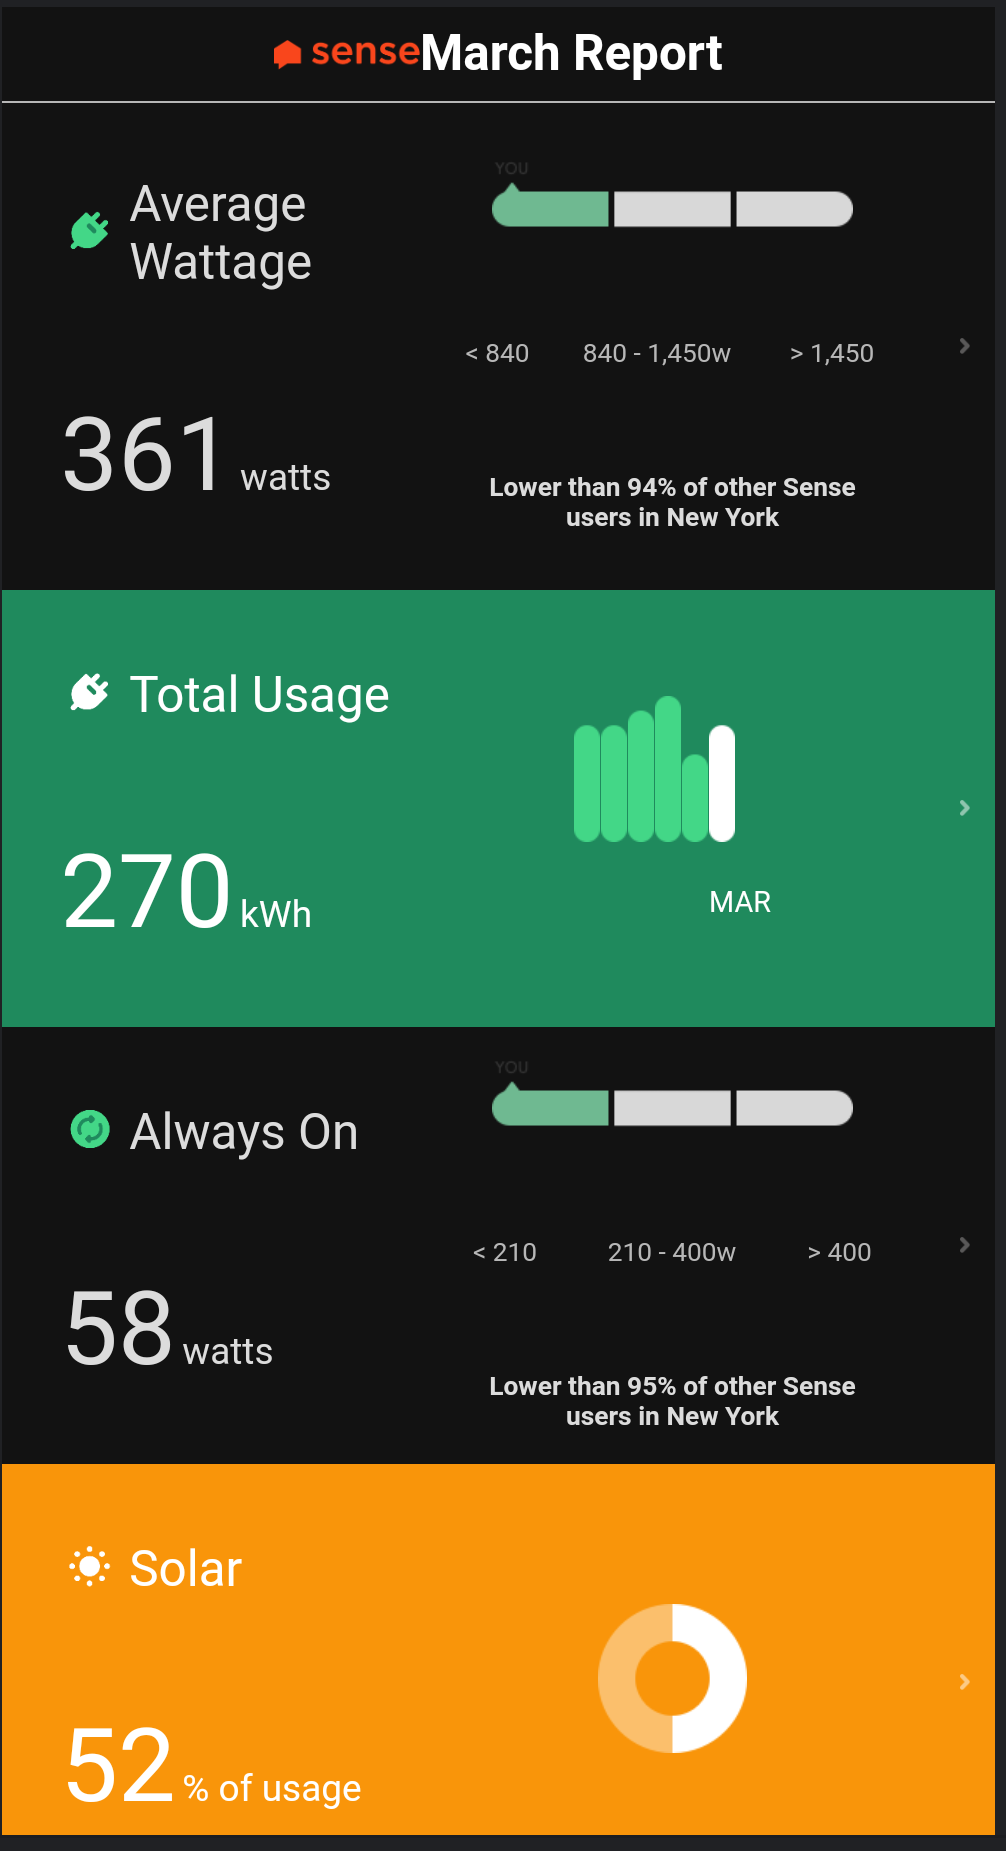
Installed my unit a few days into the month, so this is not 100% of our month’s usage. I’ve been happy with the device detection feature. Still trying to identify what a few of the “Heat” devices are.
I’m way behind on posting my monthly reports. I never did get a December 2019 report, but here are my January, February, and March 2020:
Home: Standard single-family 3k sqft of finished living space.
Goals :
Crazy month for us, we were on vacation and the kids left a TV on for the entire time driving up our always on usage.
Anyone else ever wonder why some of us have reports which are general stating:
“Lower than 91% of other similar Sense users.”
While others receive a more focused report stating:
“Lower than 95% of other Sense users in __________.”
Even more odd, ken2’s earliest report had the state he resides in, and none of his recent reports include it?!?
My own monthly reports show the same inconsistency! During the last 12-months, my usage was comparable to “Similar” (3 of 12) times.
My thought on the matter is the comparison to “Similar”, vs my explicit state was due to low-counts of actual Sense-users in my state of Ohio. Potentially, my state fluctuates near the lower-threshold of users.
Below are (9 of 12) monthly reporting cycles, depicting cycles that explicitly compared against my state (Ohio):
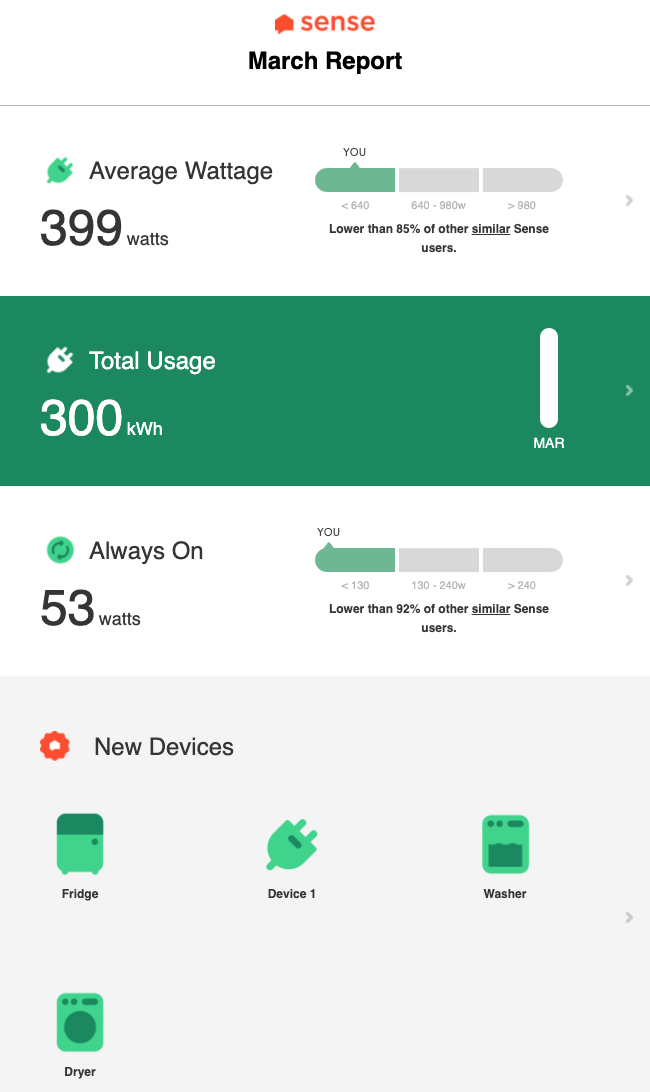
I had my Sense installed a few days into March, so this is nearly the whole month. Be interesting to compare to once things return to normal with my commute and time in the office.
Could you look into what it takes to have a focused to your state- monthly report? As invoice states in the message above yours, he thinks there may be a threshold. of users to get it focused to your state. If it is linked to a threshold, I just find it surprising California wouldn’t be in the top 10 states.
Some other interesting info is RyanAtSense posted his own in message 48. His is focused to Massachusetts. It makes sense there would be many employees there with a Sense installed. But, your own report is general!
samwooly1 originally inquired about this in message 9, but I couldn’t find a response.
Deleted original message as I noticed I did not reply as I intended.
Hi @Kevin_K. No problem.
An excerpt from this help article actually mentions the specific number required for the Similar Homes comparison.
Sense needs to see data from 15 homes in your area in order to build out this comparison. “Area” is based on the postal code that you provide under Home Details. If not enough matches are found in your immediate area, Sense will widen its search to the area defined by the first three digits of your postal code.